Indicators
Multi-Timeframe Candle Indicator for MT5: The Daily Candle on Your 1-Minute Chart
HTF Candle X-Ray puts the daily, weekly or monthly candle, its volume profile and its key levels beside your 1-minute chart.
The bigger picture you lose on the 1-minute chart
Short-term traders live on the 1-minute chart, and the 1-minute chart is very good at hiding the bigger picture. A buy that looks perfect on one minute can be right under the week’s high, or far below the price where the week did most of its trading.
HTF Candle X-Ray brings that picture to the screen you already use. It draws the higher-timeframe candle beside your chart, with its open, high, low and close, its volume profile and its point of control, and marks the period’s levels across your candles.
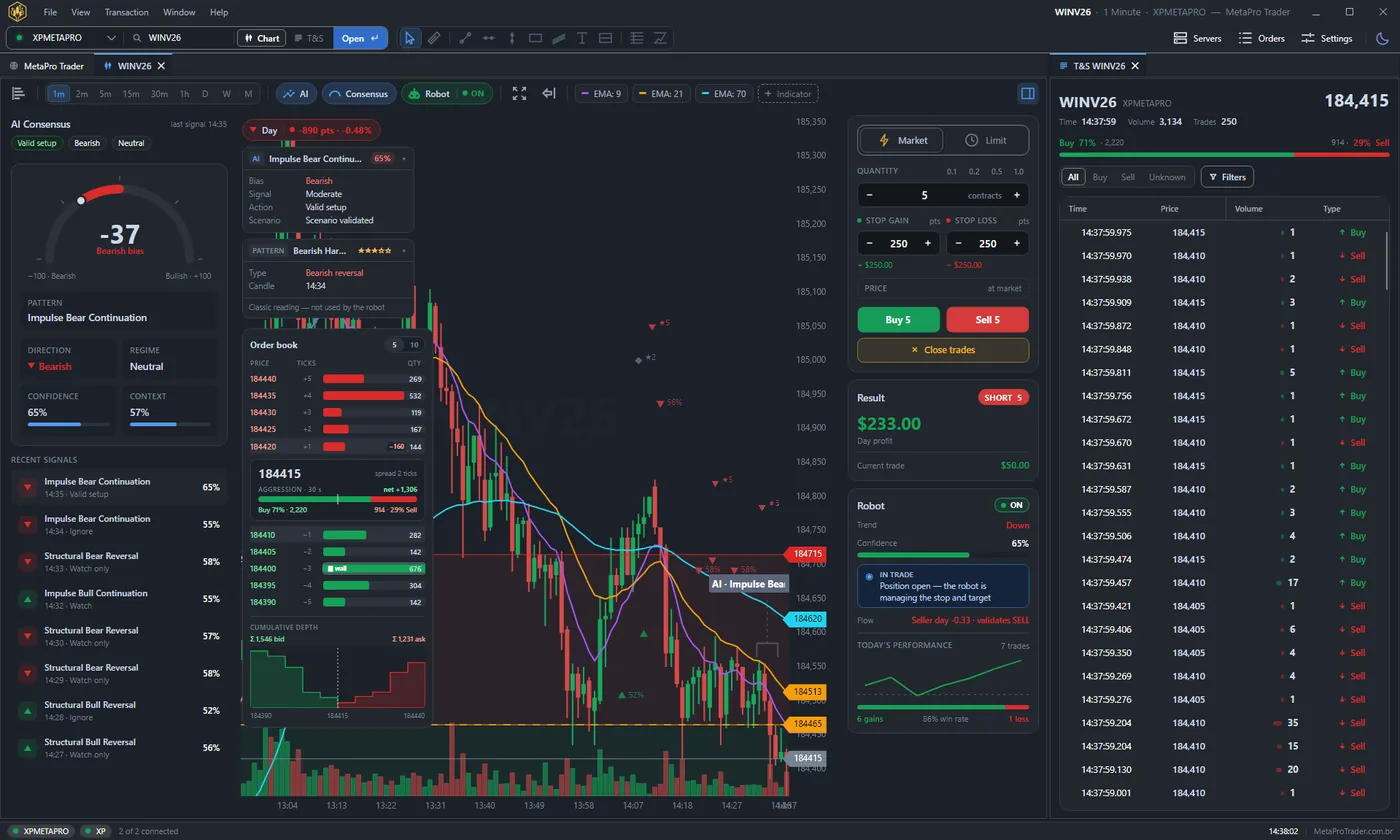
HTF Candle X-Ray belongs to MetaPro Trader, a day trading platform that connects straight to MetaTrader 5 and keeps the whole workspace in one window: the chart, with timeframes from 1 minute to monthly a click away, the Consensus AI, the order book, the order ticket and Times & Sales. The X-Ray is for the moments when you do not want to leave the 1-minute chart to look at the week.
Scene 1: a red week seen from the 1-minute chart
Wednesday, September 9, 15:00. On the 1-minute chart the mini index was recovering from a low of 186,895.
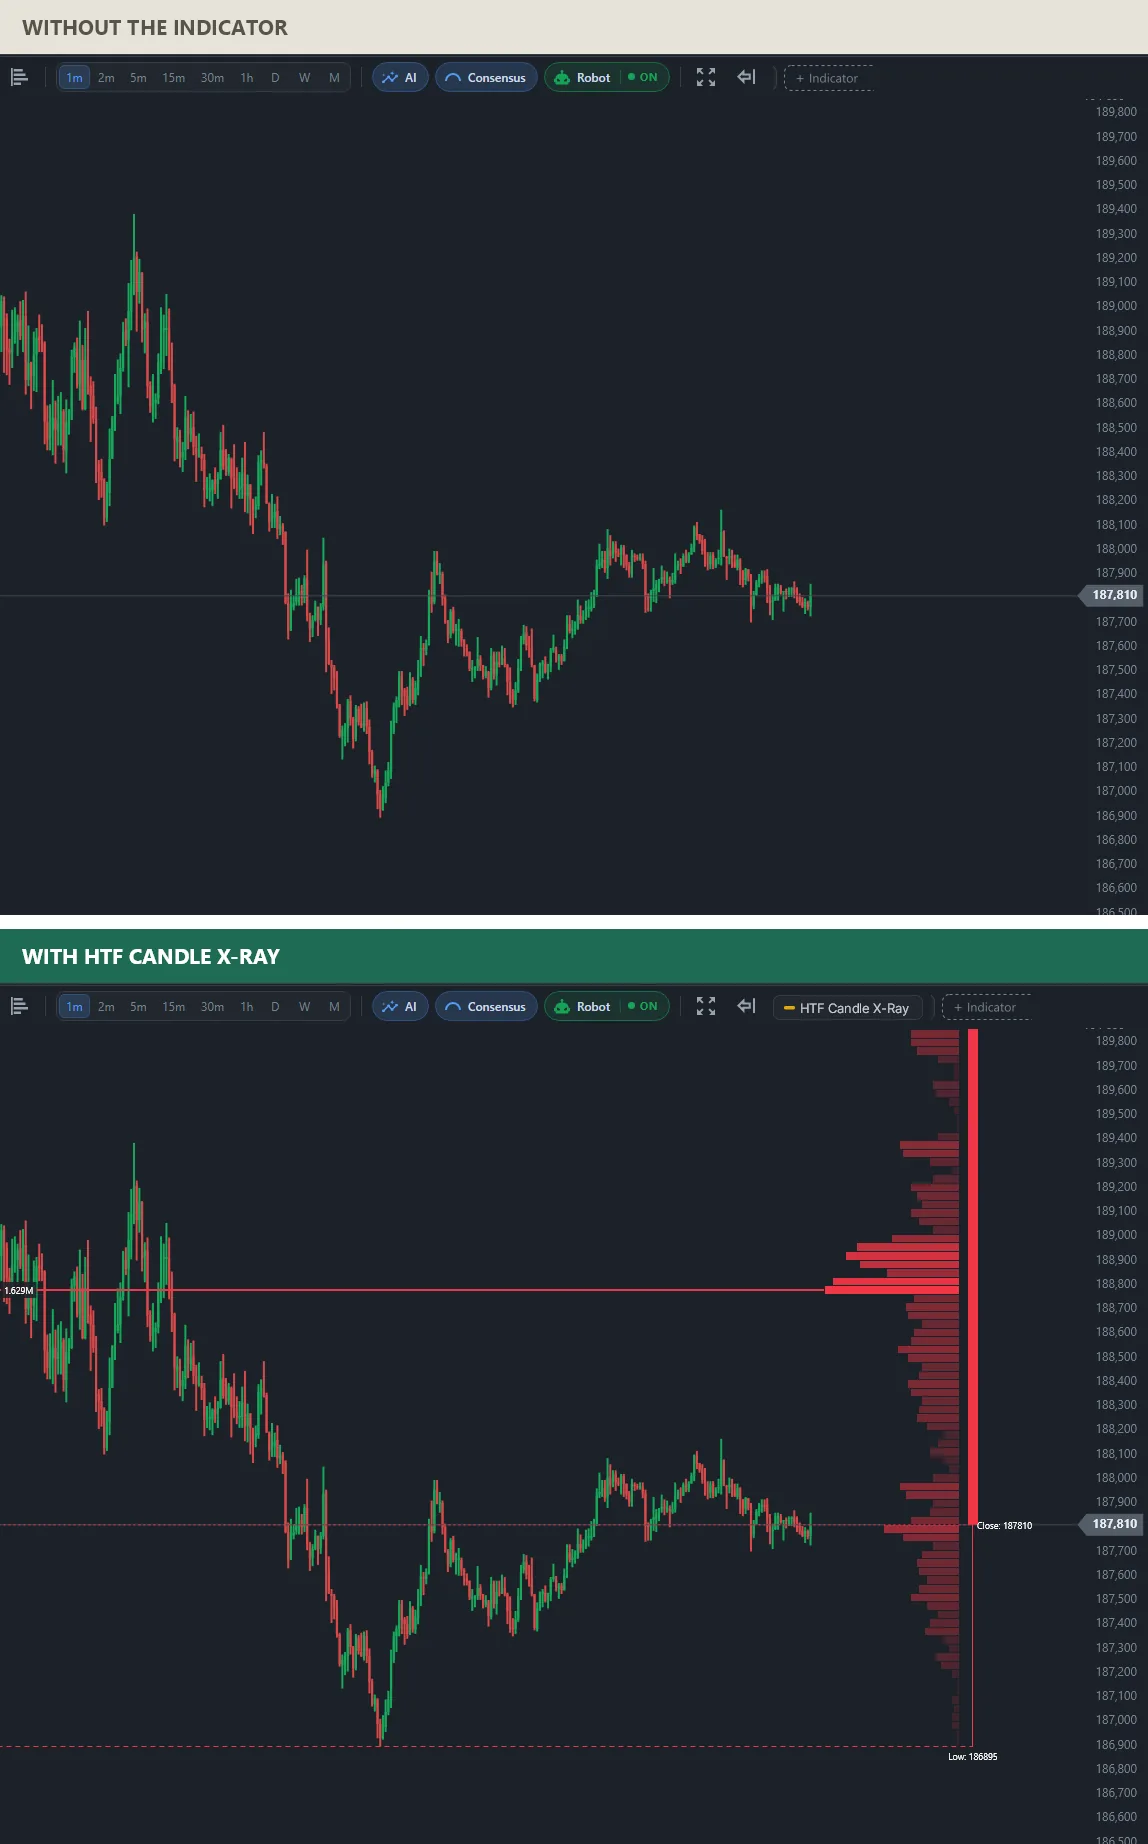
The plain chart shows a decent recovery. The X-Ray shows the week: a tall red candle with its close at 187,810 and its low at 186,895, and the week’s point of control near 188,800, with 1.629M traded there. A buyer here is buying a bounce inside a falling week, about 1,000 points under the price the week cared about most.
Scene 2: Monday, with the week’s candle still being built
Monday, September 21, 13:00. The week had just started, and so had its candle.
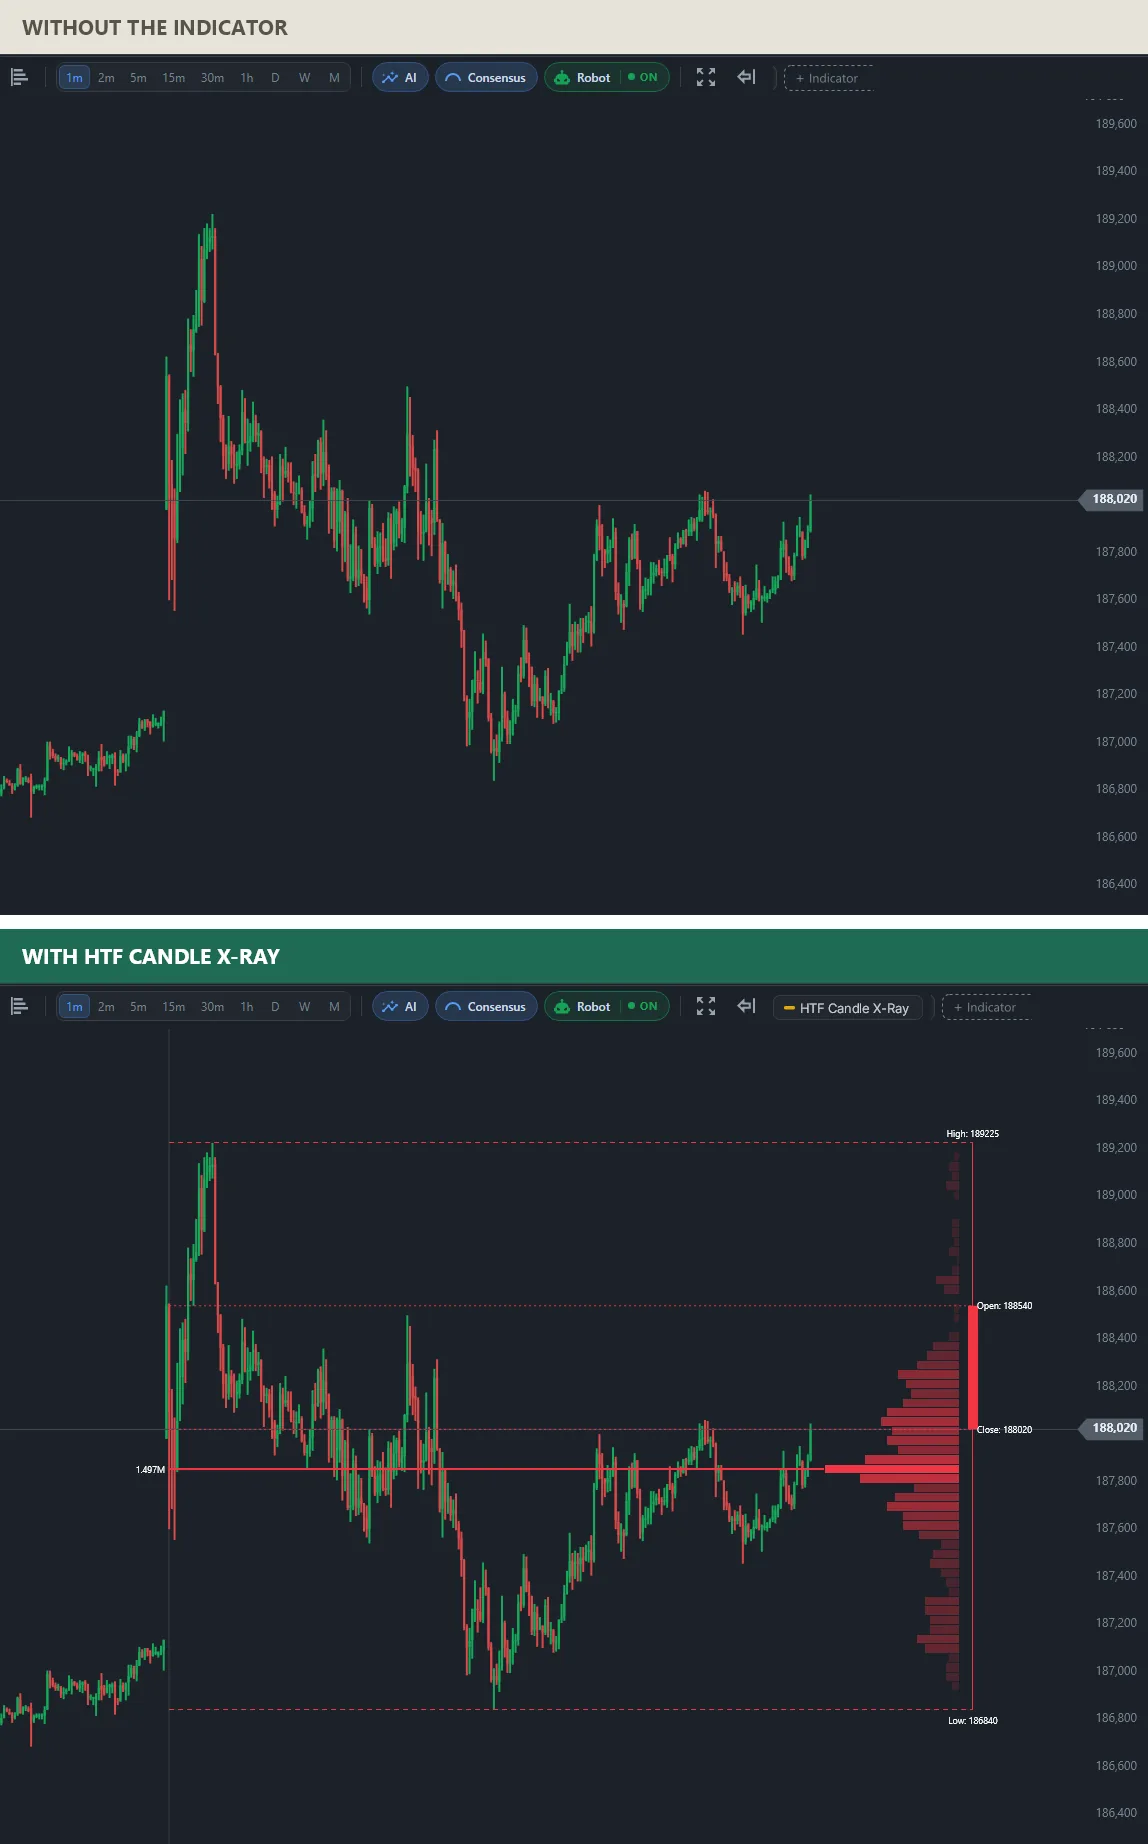
On a Monday the weekly candle is the day itself, and the X-Ray spells it out: high 189,225, open 188,540, current close 188,020 and low 186,840. The point of control is near 187,850 with 1.497M, just under the current price. The vertical line marks where the week began; to its left are the last candles of the week before.
How often the bigger picture is on your intraday screen
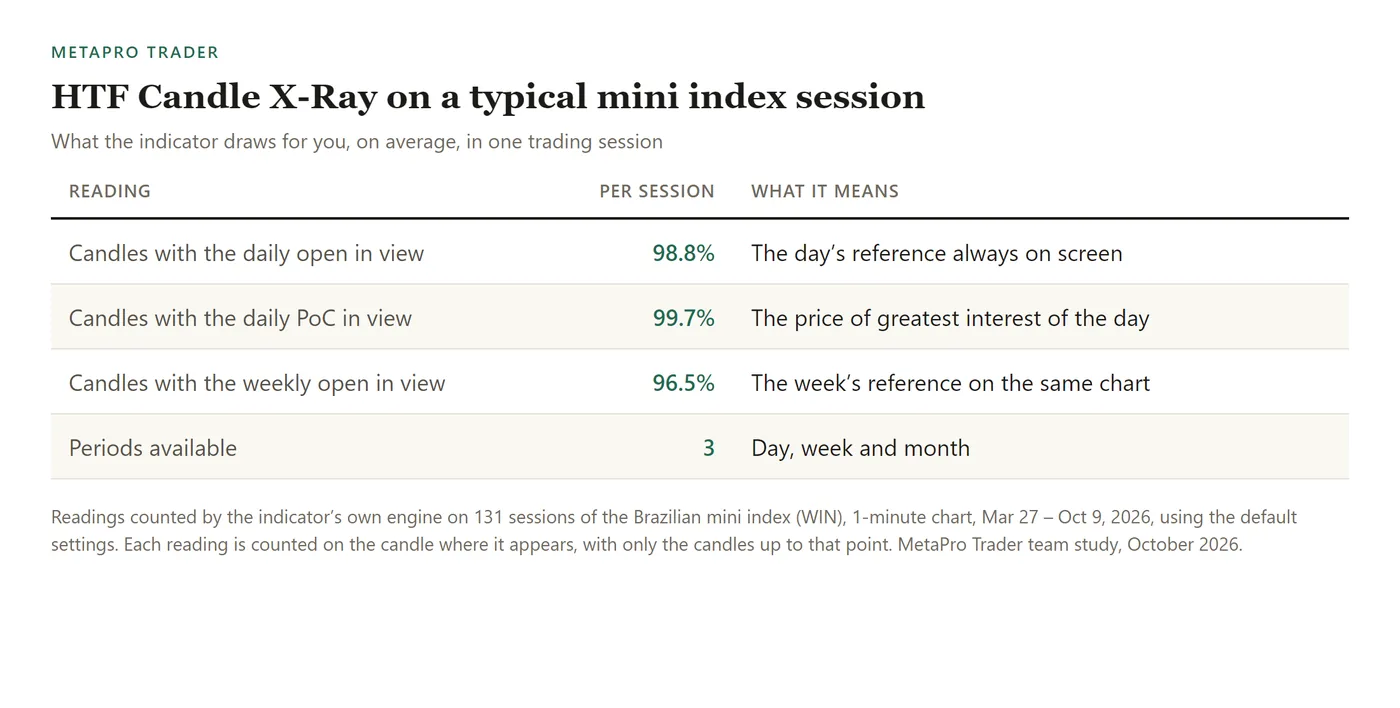
On 131 sessions of the Brazilian mini index (WIN), 1-minute chart, Mar 27 – Oct 9, 2026, the daily open was on screen on 98.8% of the 1-minute candles and the daily point of control on 99.7%; the weekly open on 96.5%. Day, week and month are available.
How to add the multi-timeframe candle indicator to MT5
Open MetaPro Trader with MetaTrader 5 connected, open the chart, click + Indicator and choose HTF Candle X-Ray in the Signals tab. Use the weekly period on the 1-minute chart to see where the day sits inside the week; the point of control line is often where price drifts back when the session gets quiet.
This article was written by the MetaPro Trader team. The charts are real mini index sessions drawn by the indicator’s own engine. Trading in financial markets involves risk of loss; the indicator helps you read the chart and does not send orders, and nothing here is investment advice.
Learn more
- Daily and weekly candle on the intraday chart for MT5
- Start the session with the levels drawn
- Volume profile for MT5 day trading
- All day trading indicators for MT5
- MetaPro Trader: AI day trading platform for MT5
Keep reading
- A day trading bot for the mini index: how we test MetaPro Scalp V2 before it goes live
- The Market Breadth Radar MetaTrader 5 Doesn’t Have: Stocks, Dollar and Foreign Indices From Different Brokers on One Chart
- Automatic Fibonacci Indicator for MT5: Day Trading Levels and Targets That Draw Themselves
- Machine Learning Trading Indicator for MT5: AI That Keeps Its Own Score on Screen
- Automatic Stop Loss and Take Profit Indicator for MT5: Trade With the Plan on the Chart
- Buy and Sell Signal Indicator for MT5: See the Turn on the Exact Candle
- Divergence Indicator for MT5: See When a Move Is Running Out of Strength
- Range Breakout Indicator for MT5: Catch the Breakout the Moment It Happens
- Volume Profile Indicator for MT5 Day Trading: Follow the Money, Not Just the Price
- Order Block Indicator With Volume for MT5: Find Where the Big Moves Came From
- Intraday Support and Resistance Indicator for MT5: Start the Session With the Levels Drawn
- Smart Money Concepts Indicator for MT5: Market Structure the Way Professionals Read It
- Automatic Chart Pattern Indicator for MT5: Head and Shoulders, Triangles and Flags Found for You
- Automatic Support and Resistance Indicator for MT5, Scored From 0 to 100
- Buying and Selling Pressure Indicator for MT5: Who Is Running the Market Right Now
- Volume-Based Support and Resistance Indicator for MT5: Levels Confirmed by Real Trading