Indicators
Volume Profile Indicator for MT5 Day Trading: Follow the Money, Not Just the Price
DeltaFlow Volume Profile shows the most traded prices, the side that dominated each one and the point of control, live on your chart.
Two prices that look the same on the chart
Two prices can look identical on a candlestick chart. At one of them almost nothing traded; at the other, hundreds of thousands of contracts changed hands. Only one of those prices is likely to matter when the market comes back.
DeltaFlow Volume Profile shows the difference. It splits the recent range into price rows, shows how much traded in each one and which side, buyers or sellers, dominated there, and highlights the price with the most trading: the point of control, or PoC.
MetaPro Trader, the platform behind these charts, keeps the raw tape one click away. Its Times & Sales window lists every trade with time, price, volume and the aggressor side, with filters for size and side and the buying and selling totals at the top. The volume profile tells you where the money went in; the tape shows who is pressing right now.
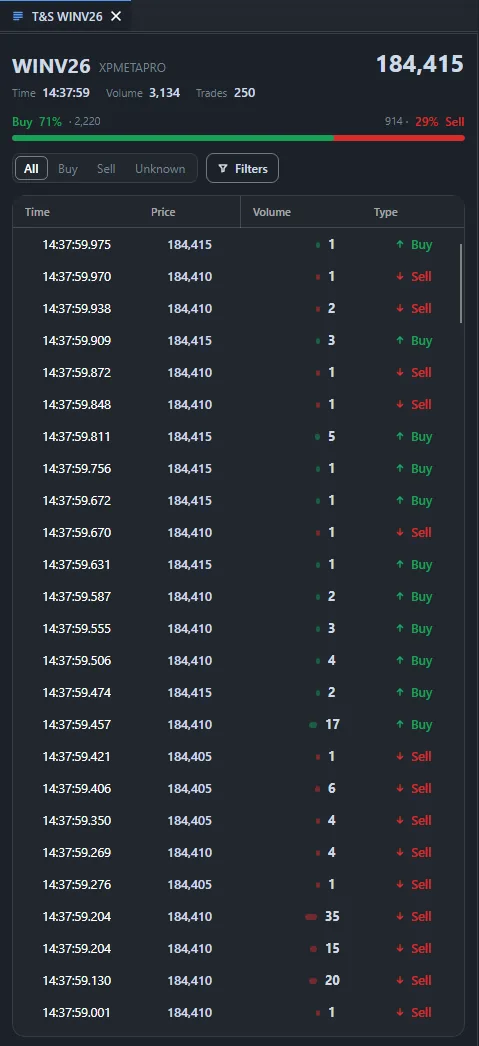
Scene 1: price back at the price of greatest interest
August 21, 13:30. The mini index rallied to 175,000, gave it all back and returned to where the day’s trading had concentrated.
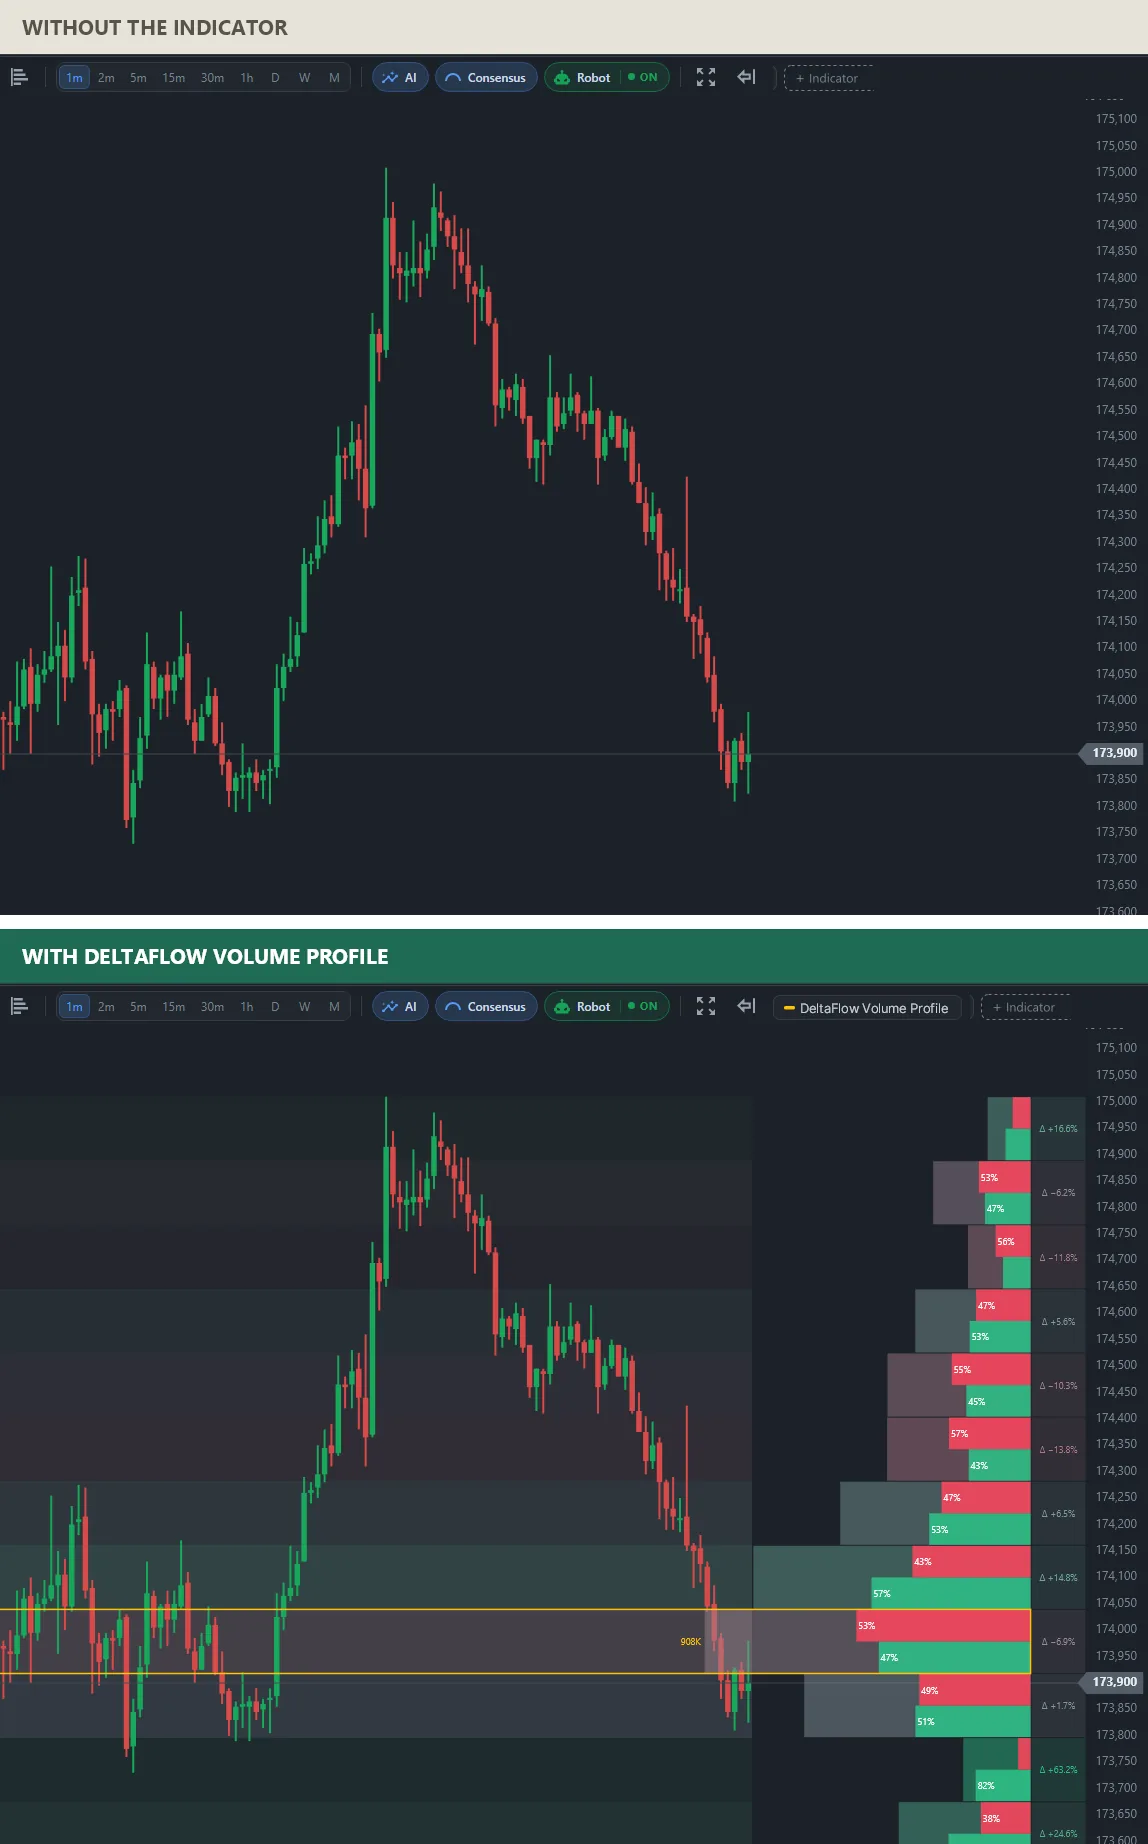
On the plain chart, 173,900 is just another price. With the profile it is the point of control: the highlighted row at about 173,975 concentrated 908K in volume, far more than the rows of the rally above it. Each row also shows the buying and selling share and the delta in percent, so you can see that the rally’s upper rows were contested, not owned by buyers.
Scene 2: a rally with buyers in control of the highs
September 15, 14:00. A steady climb took the mini index from about 187,500 to 189,525.
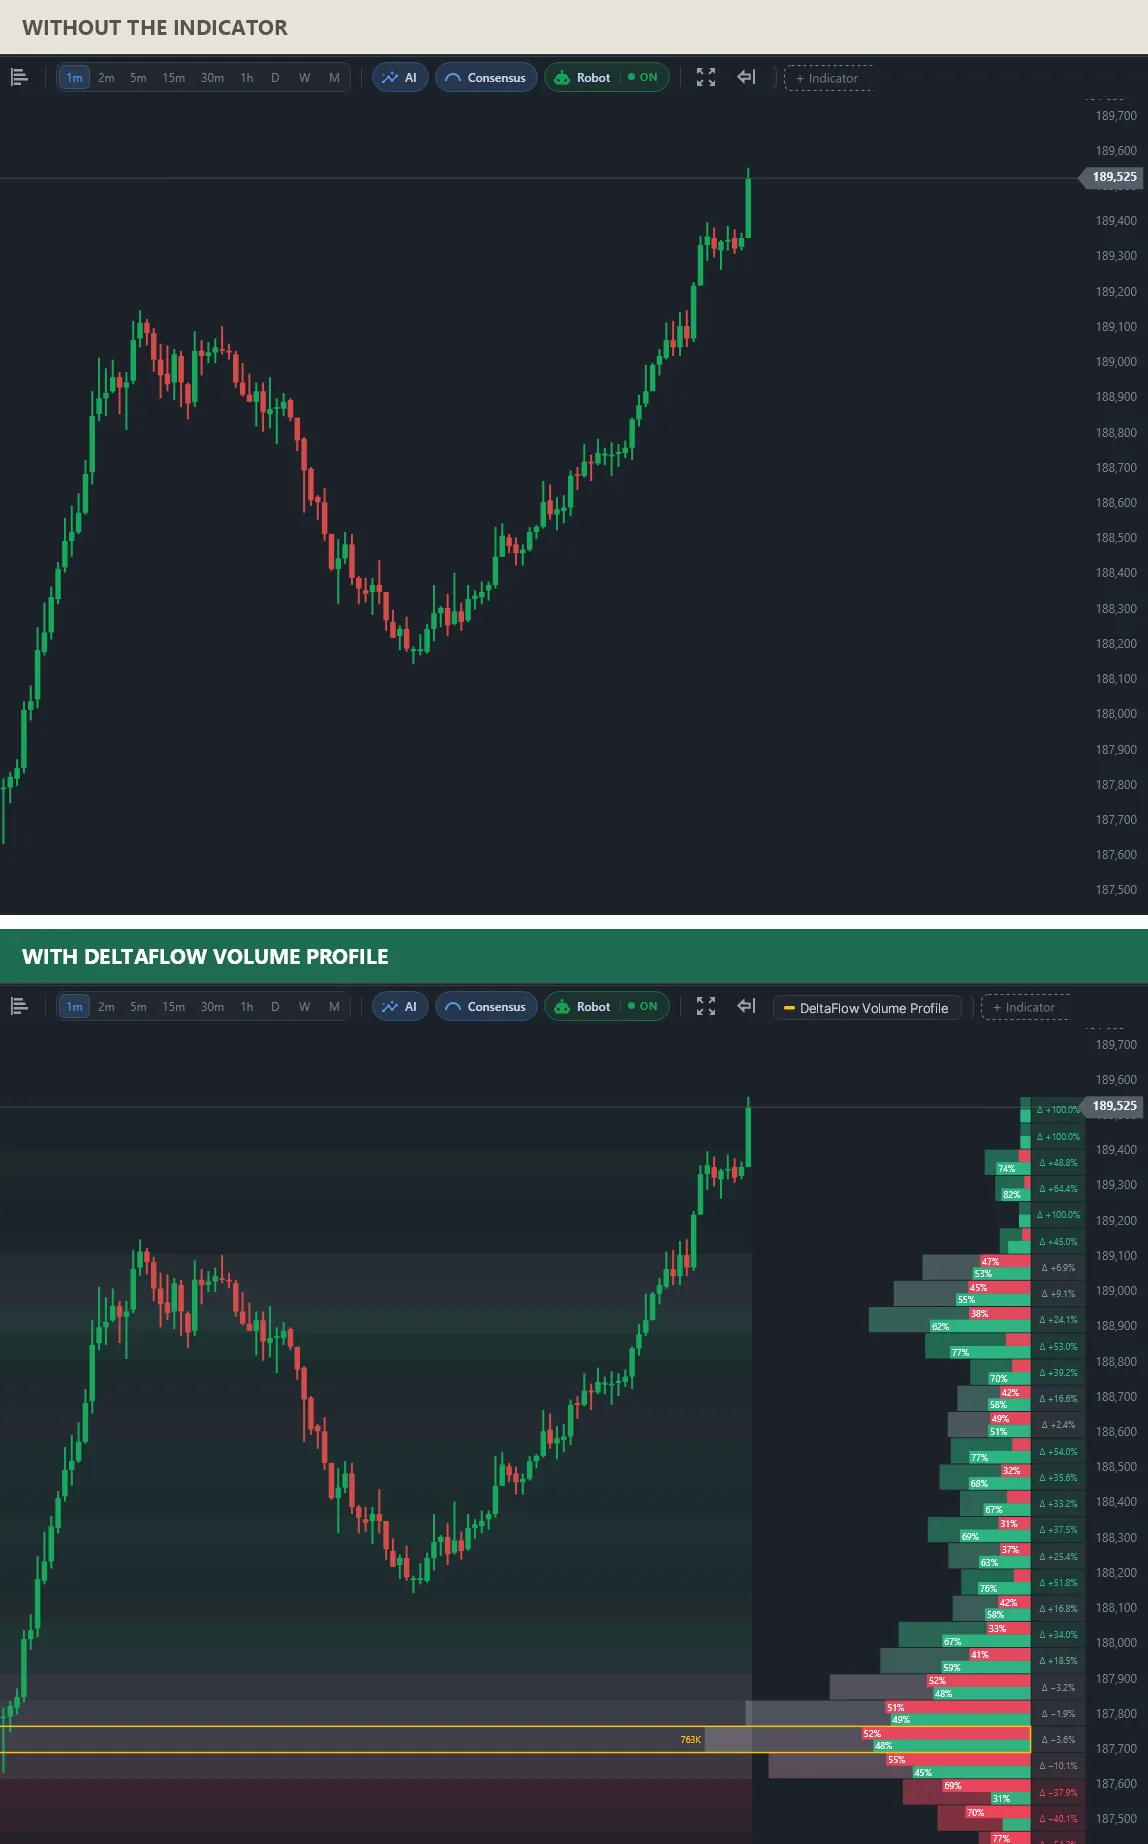
The profile tells a different story from the first scene. Here the upper rows carry strongly positive deltas, up to +100% near the high, meaning buyers did the work there. The PoC stayed at the base of the move, around 187,725, which is where the market spent the most time before the rally. If price comes back, that is the area the profile says traders cared about most.
What the volume profile updates in one mini index session
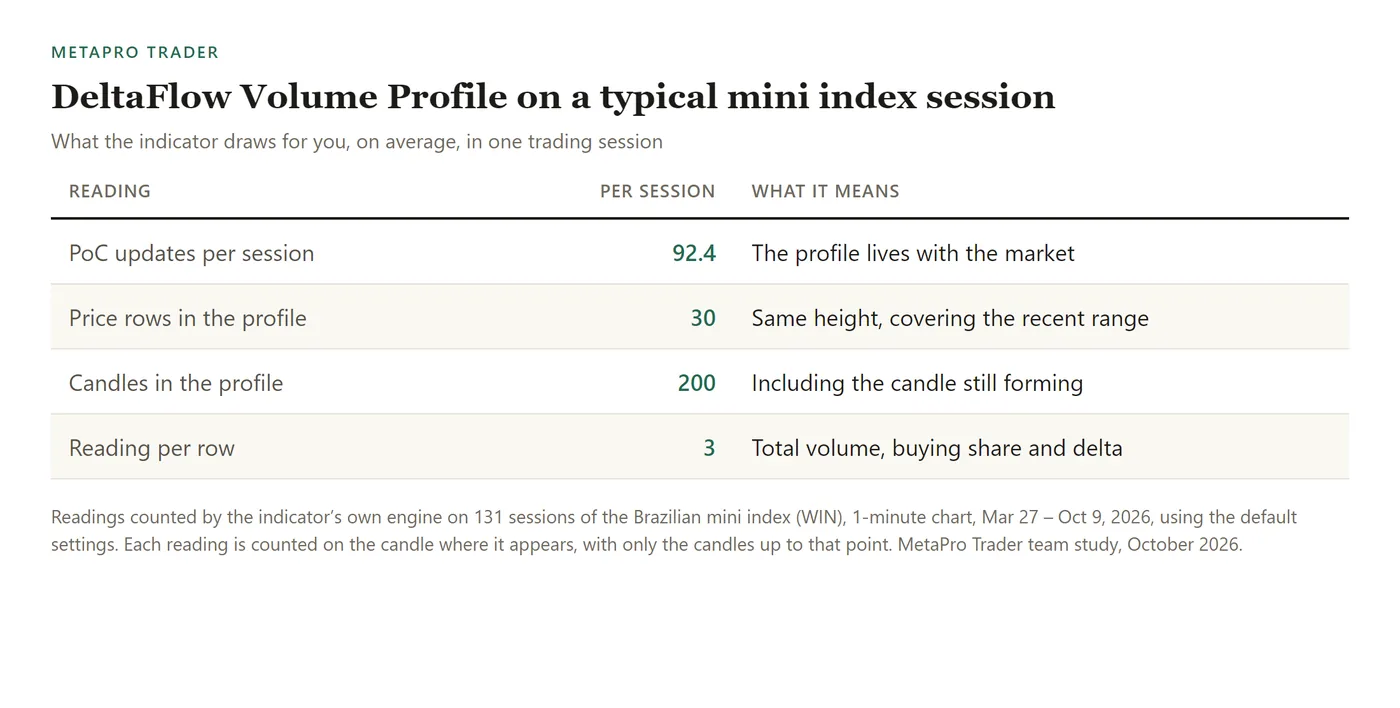
Over 131 sessions of the Brazilian mini index (WIN), 1-minute chart, Mar 27 – Oct 9, 2026, the point of control moved 92.4 times per session on average: the profile lives with the market. It is built from 30 rows covering the last 200 candles, including the one still forming.
How to add the volume profile indicator to MT5
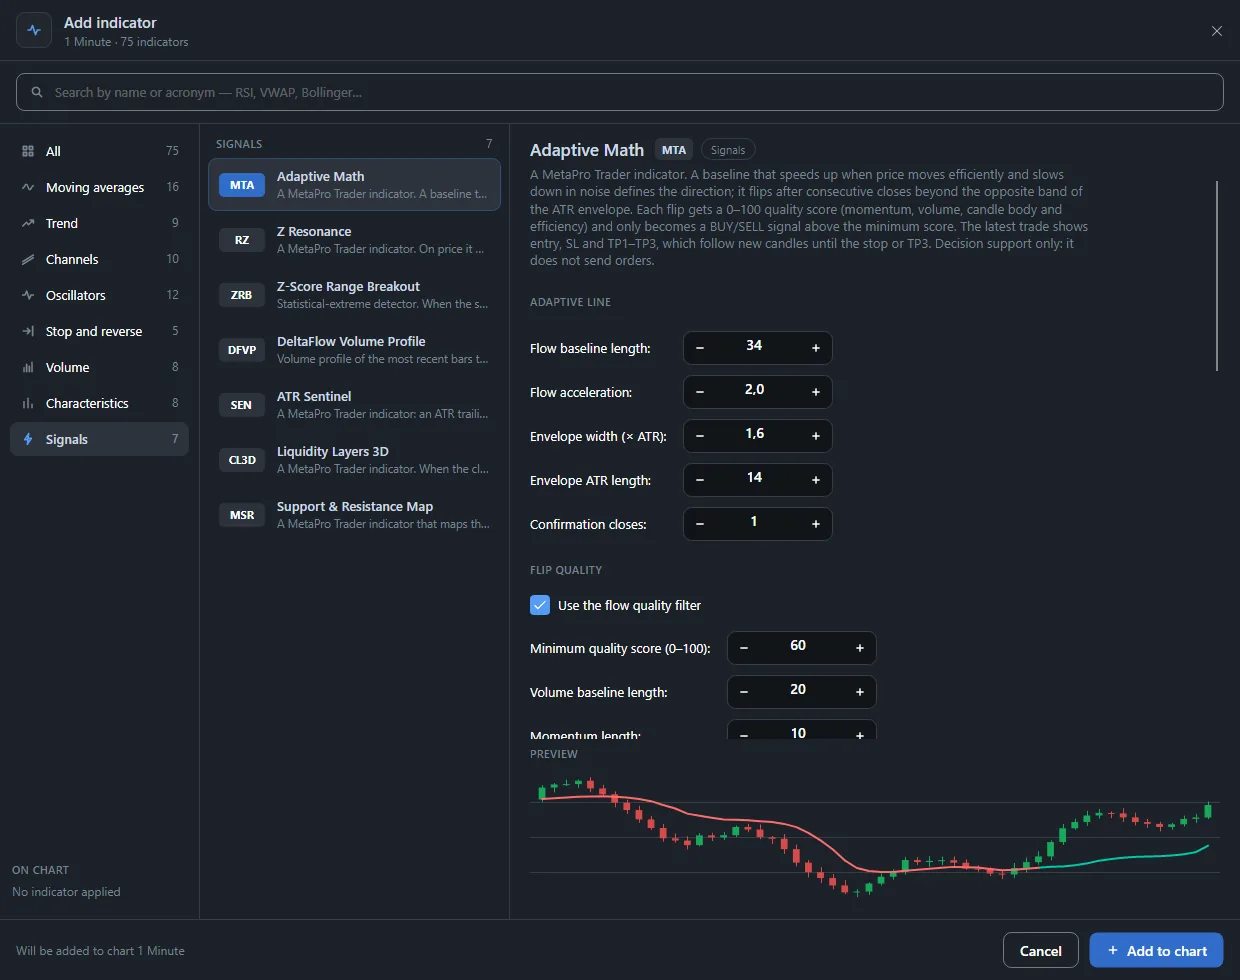
Open MetaPro Trader with your MetaTrader 5 account connected, open the asset’s chart, click + Indicator and pick DeltaFlow Volume Profile in the Signals tab. Fewer candles make a profile of the last moves; more show the value area of the whole session.
Written by the MetaPro Trader team. Every chart above is a real 1-minute mini index session, drawn by the same engine that runs in the platform. The indicator does not place orders and is not a recommendation; trading carries risk of loss.
Learn more
- Volume profile indicator for MT5 day trading
- Support and resistance confirmed by volume
- Buying and selling pressure in percent
- All day trading indicators for MT5
- MetaPro Trader: AI day trading platform for MT5
Keep reading
- A day trading bot for the mini index: how we test MetaPro Scalp V2 before it goes live
- The Market Breadth Radar MetaTrader 5 Doesn’t Have: Stocks, Dollar and Foreign Indices From Different Brokers on One Chart
- Automatic Fibonacci Indicator for MT5: Day Trading Levels and Targets That Draw Themselves
- Machine Learning Trading Indicator for MT5: AI That Keeps Its Own Score on Screen
- Automatic Stop Loss and Take Profit Indicator for MT5: Trade With the Plan on the Chart
- Buy and Sell Signal Indicator for MT5: See the Turn on the Exact Candle
- Divergence Indicator for MT5: See When a Move Is Running Out of Strength
- Range Breakout Indicator for MT5: Catch the Breakout the Moment It Happens
- Order Block Indicator With Volume for MT5: Find Where the Big Moves Came From
- Intraday Support and Resistance Indicator for MT5: Start the Session With the Levels Drawn
- Smart Money Concepts Indicator for MT5: Market Structure the Way Professionals Read It
- Automatic Chart Pattern Indicator for MT5: Head and Shoulders, Triangles and Flags Found for You
- Automatic Support and Resistance Indicator for MT5, Scored From 0 to 100
- Buying and Selling Pressure Indicator for MT5: Who Is Running the Market Right Now
- Volume-Based Support and Resistance Indicator for MT5: Levels Confirmed by Real Trading
- Multi-Timeframe Candle Indicator for MT5: The Daily Candle on Your 1-Minute Chart