Indicators
Buy and Sell Signal Indicator for MT5: See the Turn on the Exact Candle
ATR Sentinel marks buy and sell turns on the closing candle and paints every candle with the market’s side, on any MT5 chart.
Has the market turned, or is this a pullback?
Every trend-following trader faces the same small question dozens of times a day: has the market turned, or is this just a pullback? Answering it by eye means comparing candles, checking a moving average, maybe opening a second timeframe. By the time the answer is clear, the move is half gone.
ATR Sentinel turns that question into a color. It keeps a volatility-based trailing line behind price and paints every candle with the side the market is on. When price crosses the line, a Buy or Sell label appears on that exact candle, and it stays there once the candle closes.
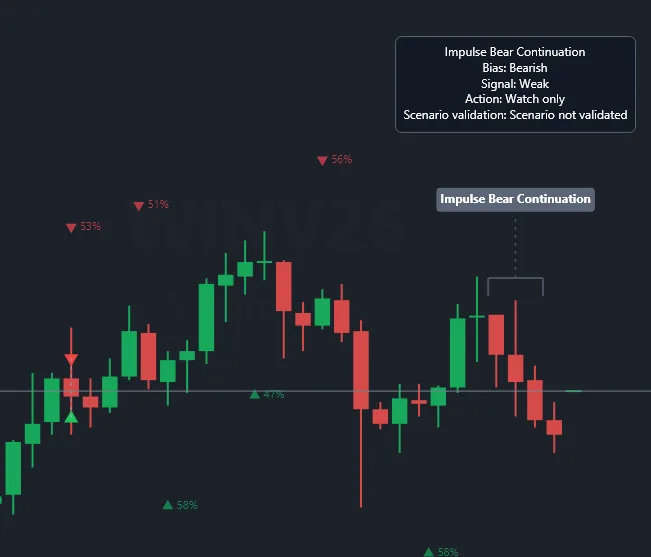
ATR Sentinel is one of the reading tools inside MetaPro Trader, a day trading platform for MT5 built around an AI that is prepared separately for each asset. Switch the AI on and it marks on the chart the patterns it recognizes in that asset’s own history, with the bias, the signal strength and the suggested action next to each one. The Sentinel tells you which side the market is on; the AI tells you what kind of move it thinks this is.
Scene 1: a rally of almost 1,000 points, side by side
July 22, 13:30. The mini index climbed from about 180,100 to 181,085 in under two hours.
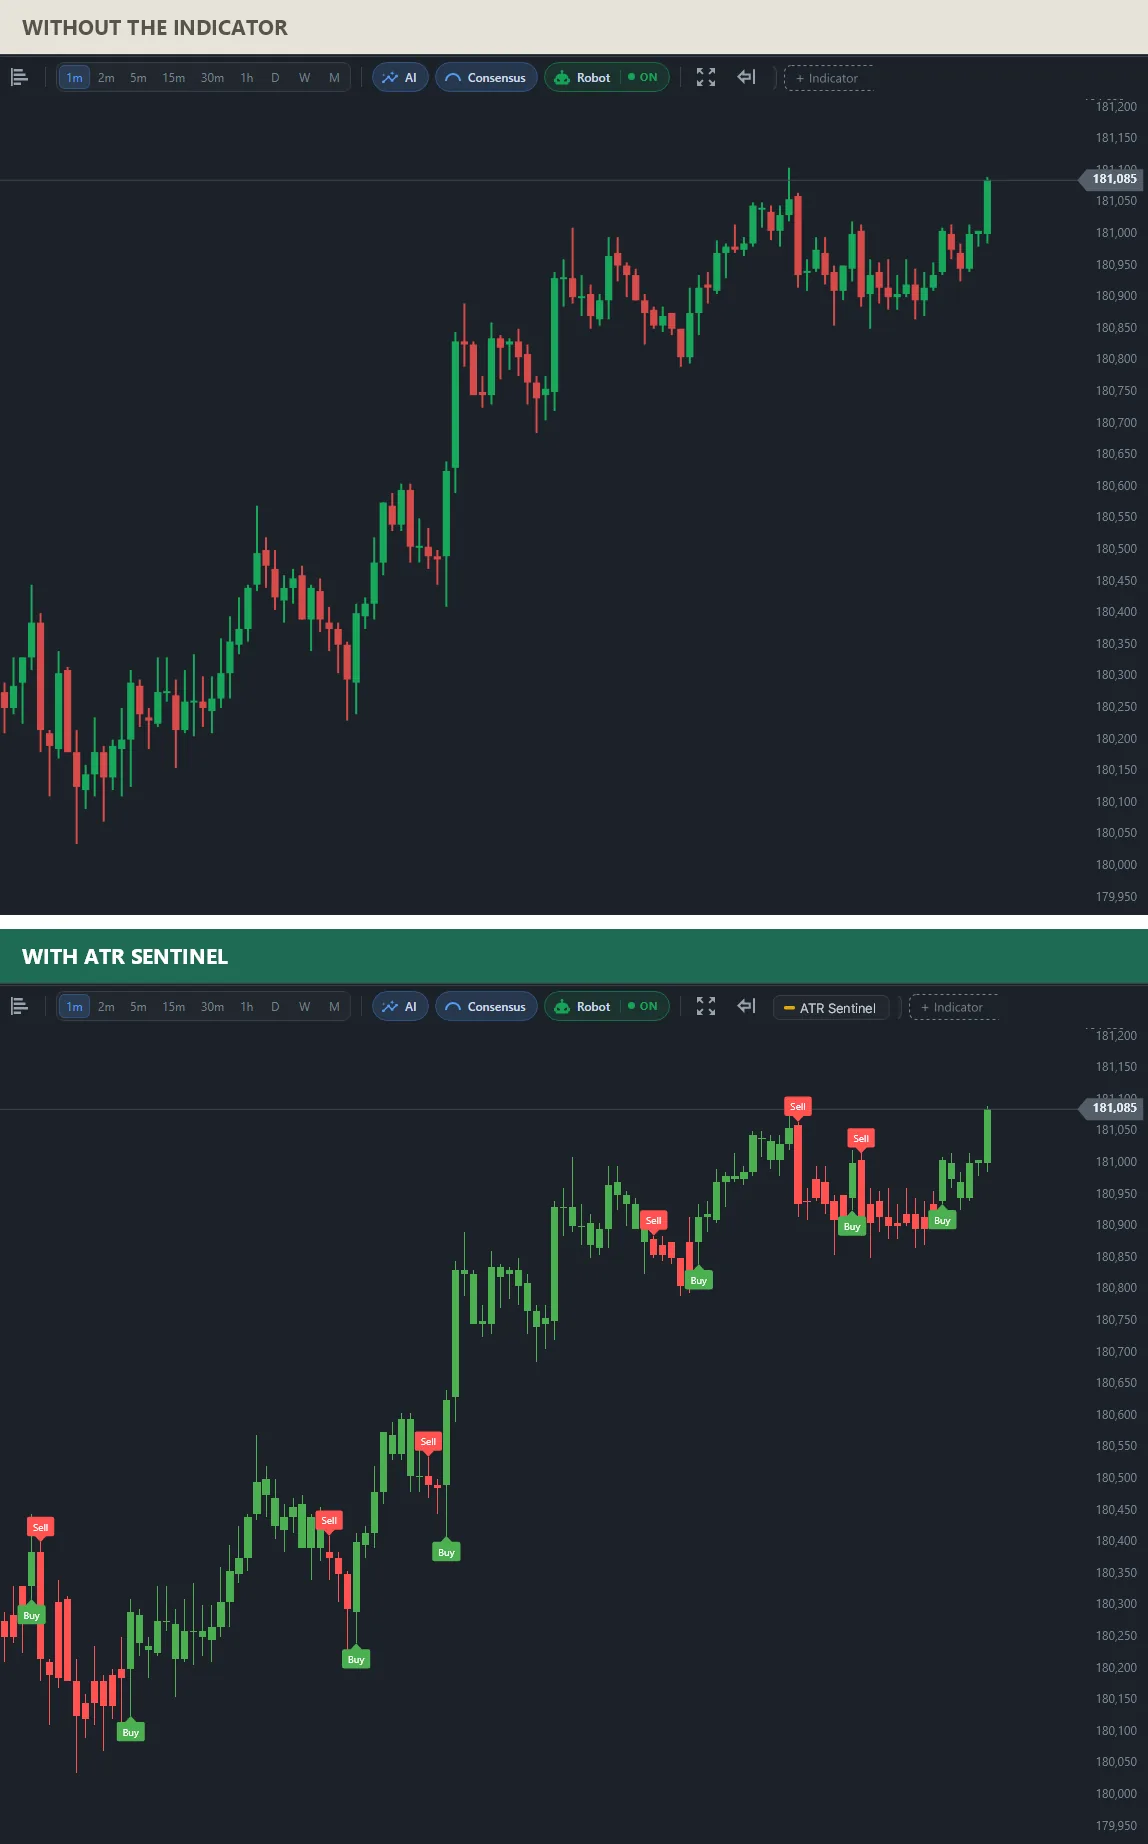
On the plain chart every red candle in the rally is a doubt. With ATR Sentinel the rally reads as long green stretches with a few short interruptions, and each interruption is labeled: a Sell where the side changed, a Buy where it changed back. Near the top, where price went sideways, the labels come closer together. That clustering is information too: it is the market losing direction.
Scene 2: the same reading on a falling market
July 29, noon. This time the mini index fell from about 180,700 to 179,265.
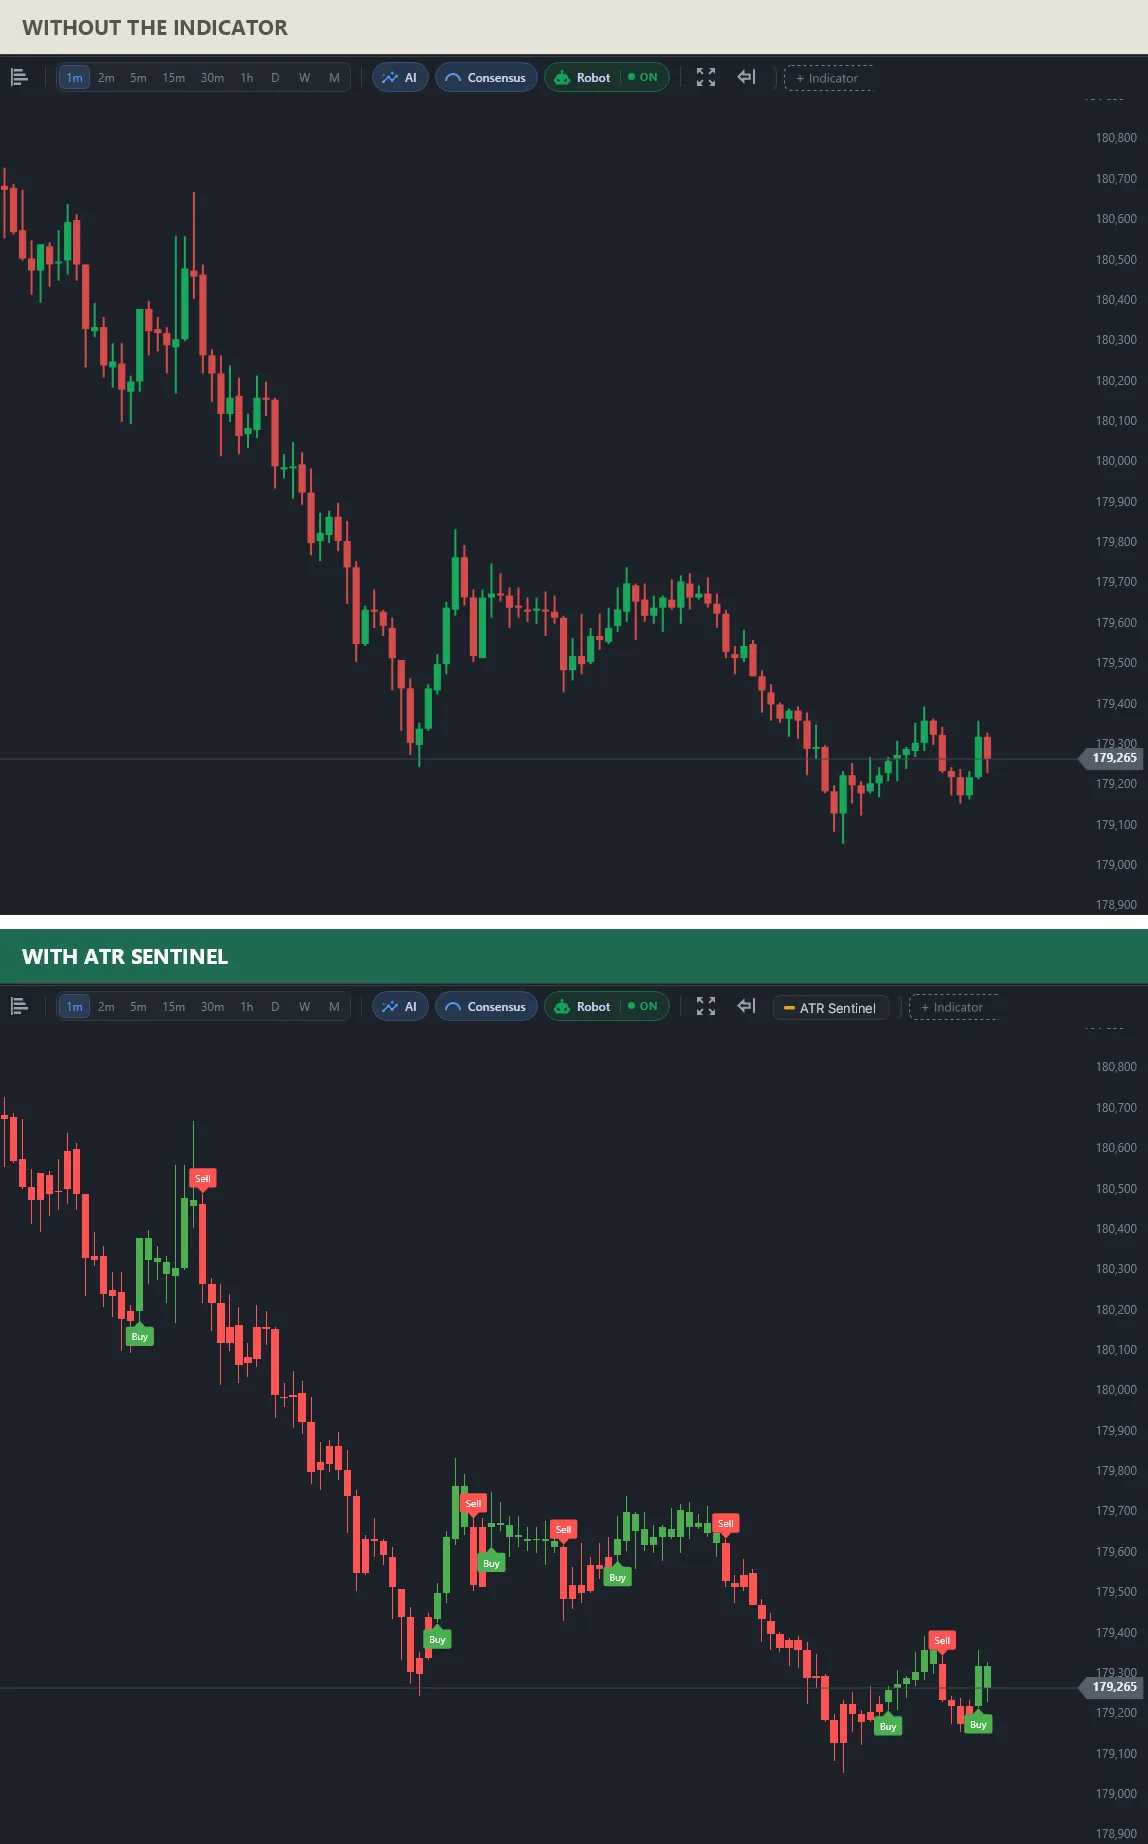
The Sell label sits at the start of the fall, near 180,500, and from there the chart is mostly red. The short bounces are marked as Buys and turn back to Sells a few candles later, which is how a trailing line behaves inside a downtrend: it lets you see the bounce without pretending it is a new trend.
How often the buy and sell indicator marks a turn on the mini index
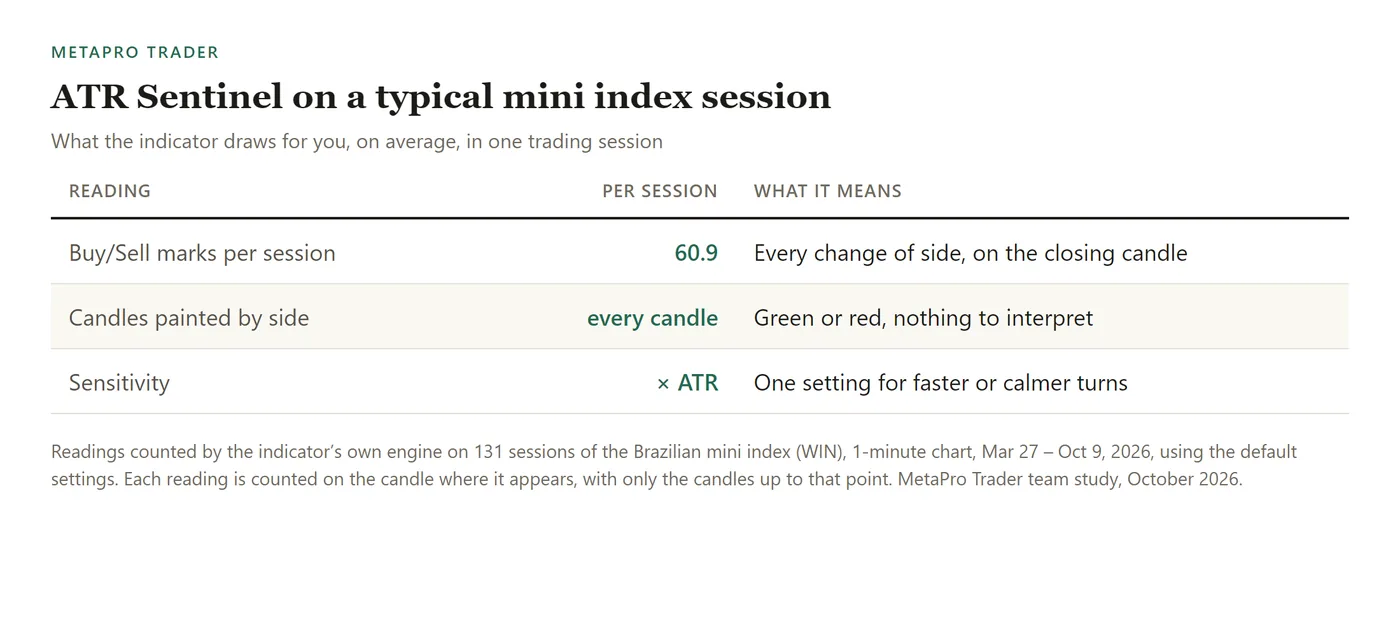
Over 131 sessions of the Brazilian mini index (WIN), 1-minute chart, Mar 27 – Oct 9, 2026, ATR Sentinel marked an average of 60.9 changes of side per session on the 1-minute chart, always on the closing candle. That is the default sensitivity; one setting makes it calmer.
How to add the buy and sell signal indicator to MT5
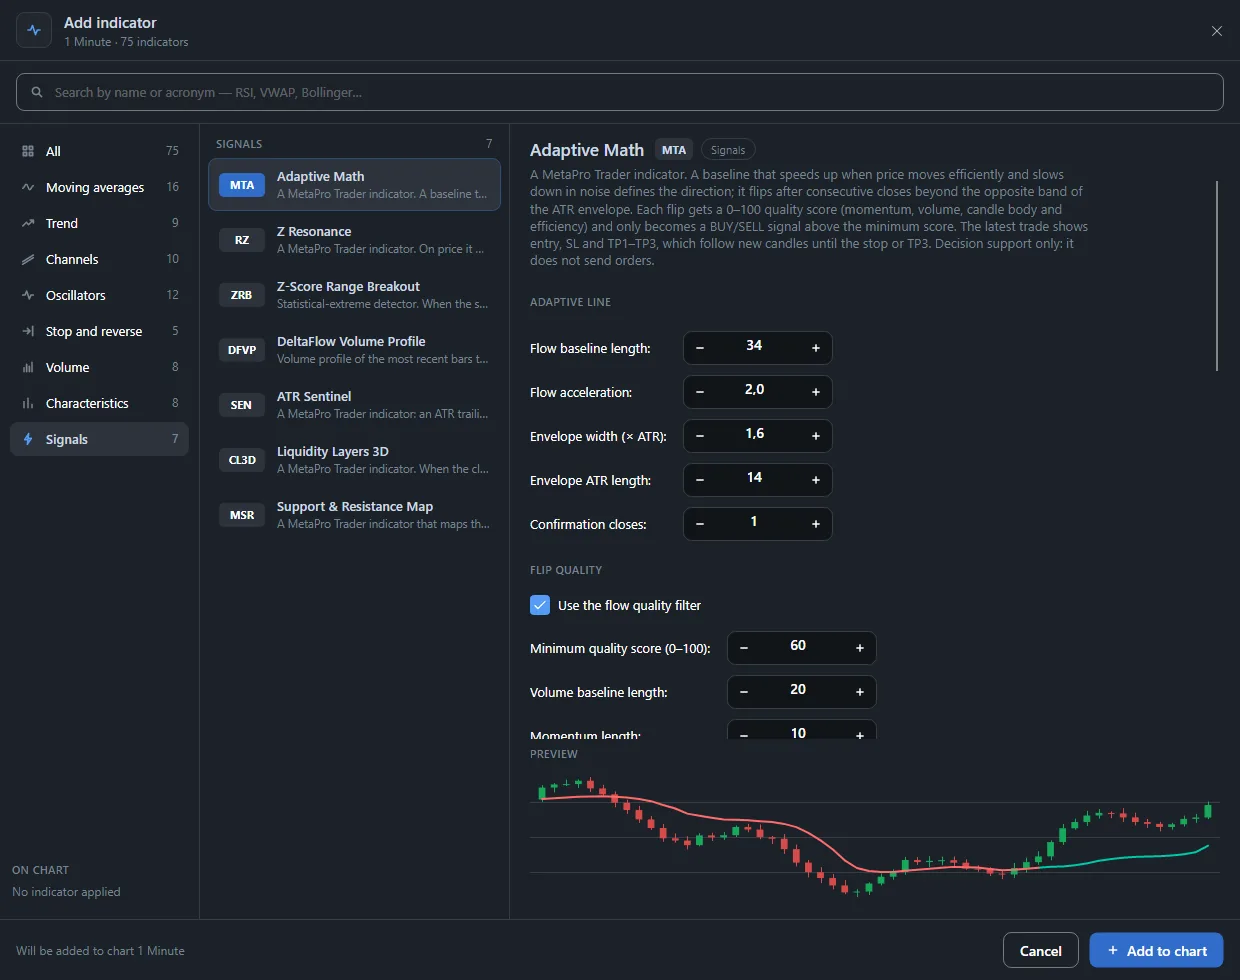
With your MetaTrader 5 account connected in MetaPro Trader, open the chart, click + Indicator, go to the Signals tab and pick ATR Sentinel. Raise the sensitivity (× ATR) to keep only the bigger turns, and turn on the trailing line under Display when you want to see exactly where the next turn would happen.
Written by the MetaPro Trader team. Every chart above is a real 1-minute mini index session, drawn by the same engine that runs in the platform. The indicator does not place orders and is not a recommendation; trading carries risk of loss.
Learn more
- Buy and sell signal indicator for MT5 day trading
- Automatic stop loss and take profit targets
- See when a move is running out of strength
- The full list of MetaPro Trader indicators
- MetaPro Trader for MetaTrader 5
Keep reading
- A day trading bot for the mini index: how we test MetaPro Scalp V2 before it goes live
- The Market Breadth Radar MetaTrader 5 Doesn’t Have: Stocks, Dollar and Foreign Indices From Different Brokers on One Chart
- Automatic Fibonacci Indicator for MT5: Day Trading Levels and Targets That Draw Themselves
- Machine Learning Trading Indicator for MT5: AI That Keeps Its Own Score on Screen
- Automatic Stop Loss and Take Profit Indicator for MT5: Trade With the Plan on the Chart
- Divergence Indicator for MT5: See When a Move Is Running Out of Strength
- Range Breakout Indicator for MT5: Catch the Breakout the Moment It Happens
- Volume Profile Indicator for MT5 Day Trading: Follow the Money, Not Just the Price
- Order Block Indicator With Volume for MT5: Find Where the Big Moves Came From
- Intraday Support and Resistance Indicator for MT5: Start the Session With the Levels Drawn
- Smart Money Concepts Indicator for MT5: Market Structure the Way Professionals Read It
- Automatic Chart Pattern Indicator for MT5: Head and Shoulders, Triangles and Flags Found for You
- Automatic Support and Resistance Indicator for MT5, Scored From 0 to 100
- Buying and Selling Pressure Indicator for MT5: Who Is Running the Market Right Now
- Volume-Based Support and Resistance Indicator for MT5: Levels Confirmed by Real Trading
- Multi-Timeframe Candle Indicator for MT5: The Daily Candle on Your 1-Minute Chart