Indicators
Order Block Indicator With Volume for MT5: Find Where the Big Moves Came From
Liquidity Layers 3D draws order blocks with the buying and selling share of each zone and marks every return of price to them.
Where big moves start
Big moves rarely start from nowhere. Before the breakout there is usually a short zone where large orders were absorbed, and when price comes back to that zone, the same participants often defend it again.
Liquidity Layers 3D finds those launch zones on its own and draws them as layers on the chart. Each layer shows how much of its volume was buying and how much was selling, and a small mark appears every time price returns to it.
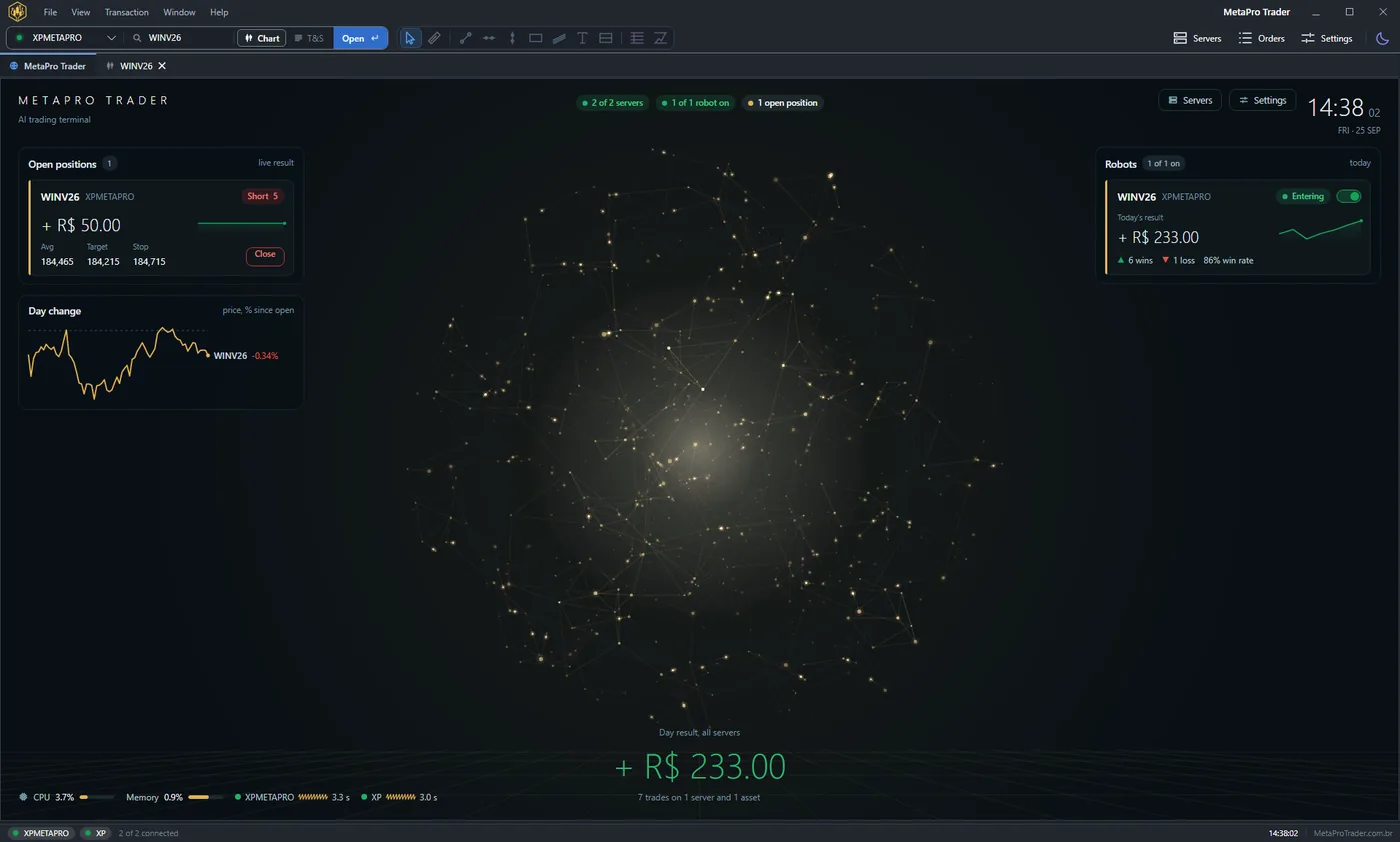
These layers were drawn in MetaPro Trader, a day trading platform for MT5 with a Dashboard that follows every account at once: open positions, the day’s change of each asset, a card for each robot with its current intent, and the result of the day across all connected servers. It is the screen you look at between charts.
Scene 1: three launch zones under a rising market
July 30, 13:00. The mini index was grinding higher towards 179,920.
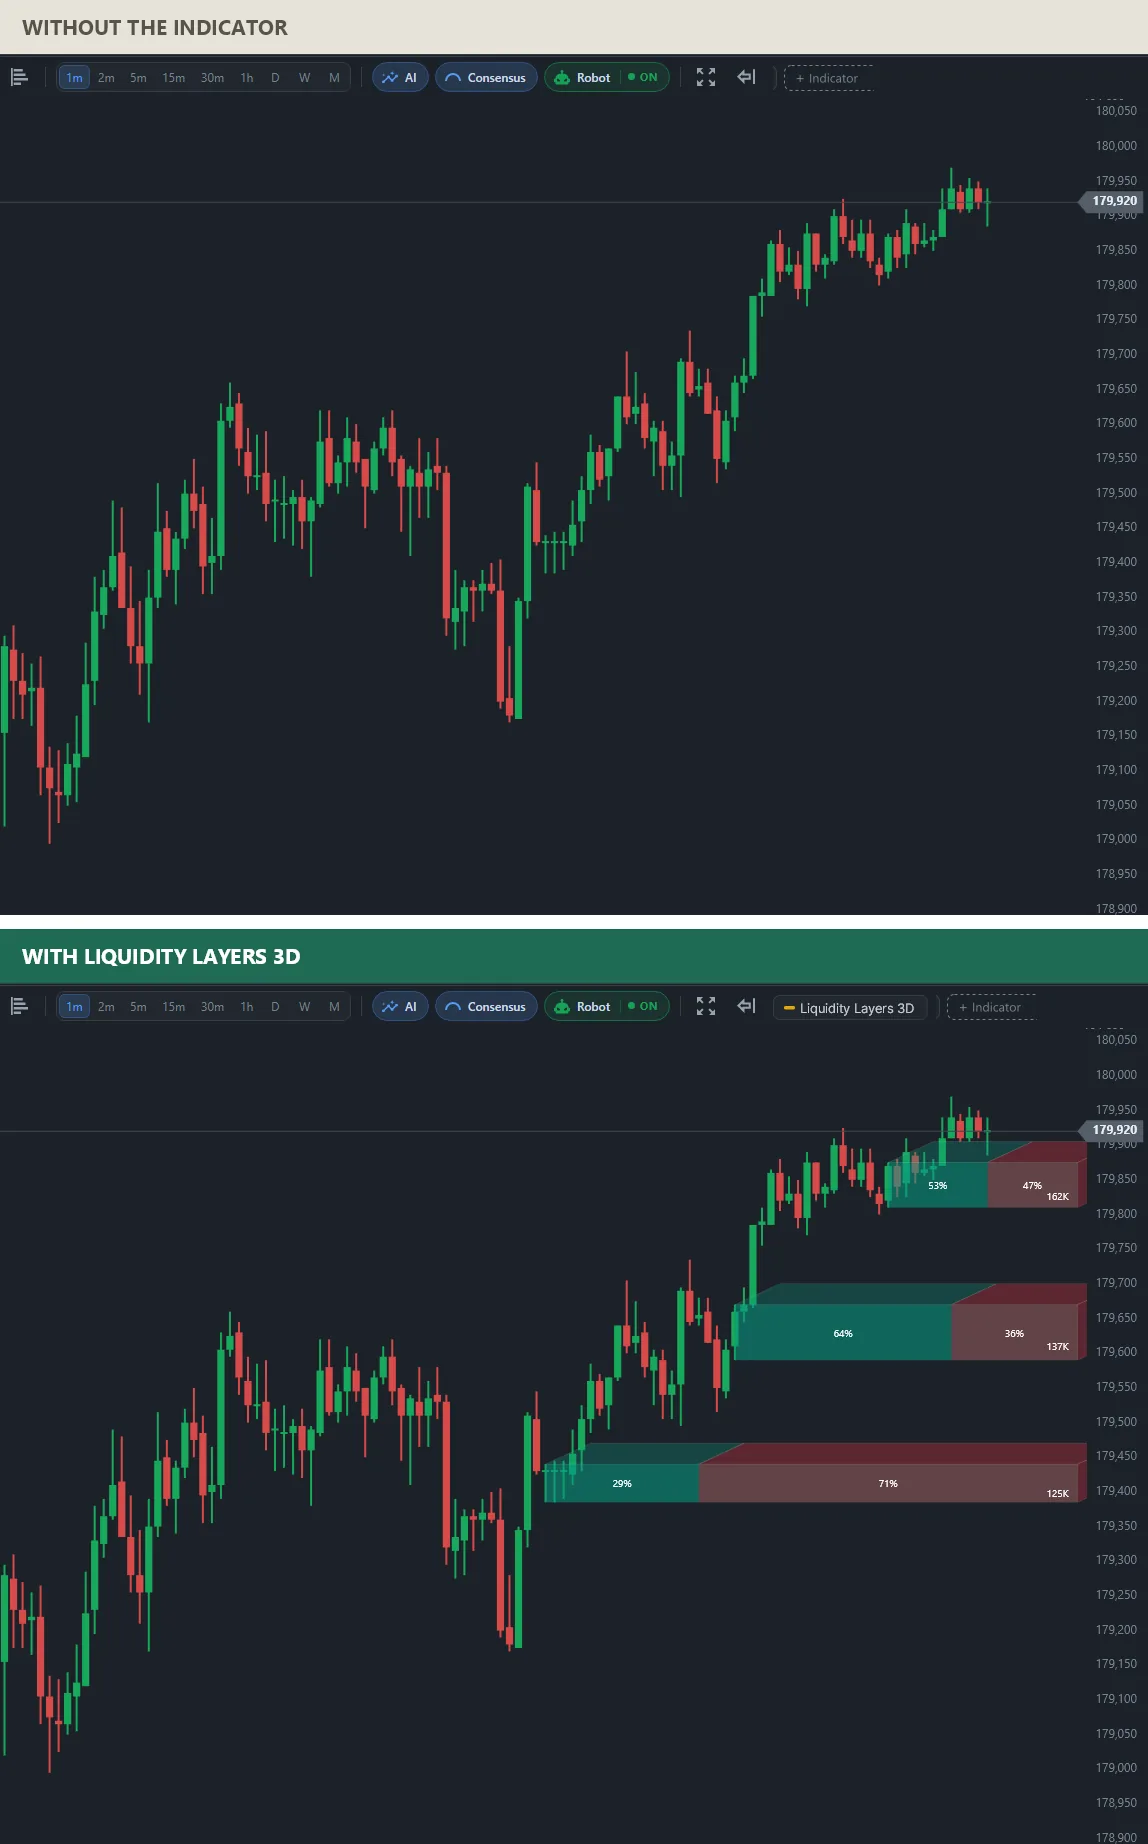
The plain chart shows a climb. Liquidity Layers 3D shows where the climb was built: three layers below price, each with its own reading. The middle one, around 179,600–179,680, was 64% buying with 137K in volume; the lowest, around 179,380–179,450, was 71% selling. Two layers at similar prices can mean very different things, and the shares tell you which is which.
Scene 2: supply stacked above a falling market
August 6, 14:00. The mini index was falling from about 180,700 to 179,700.
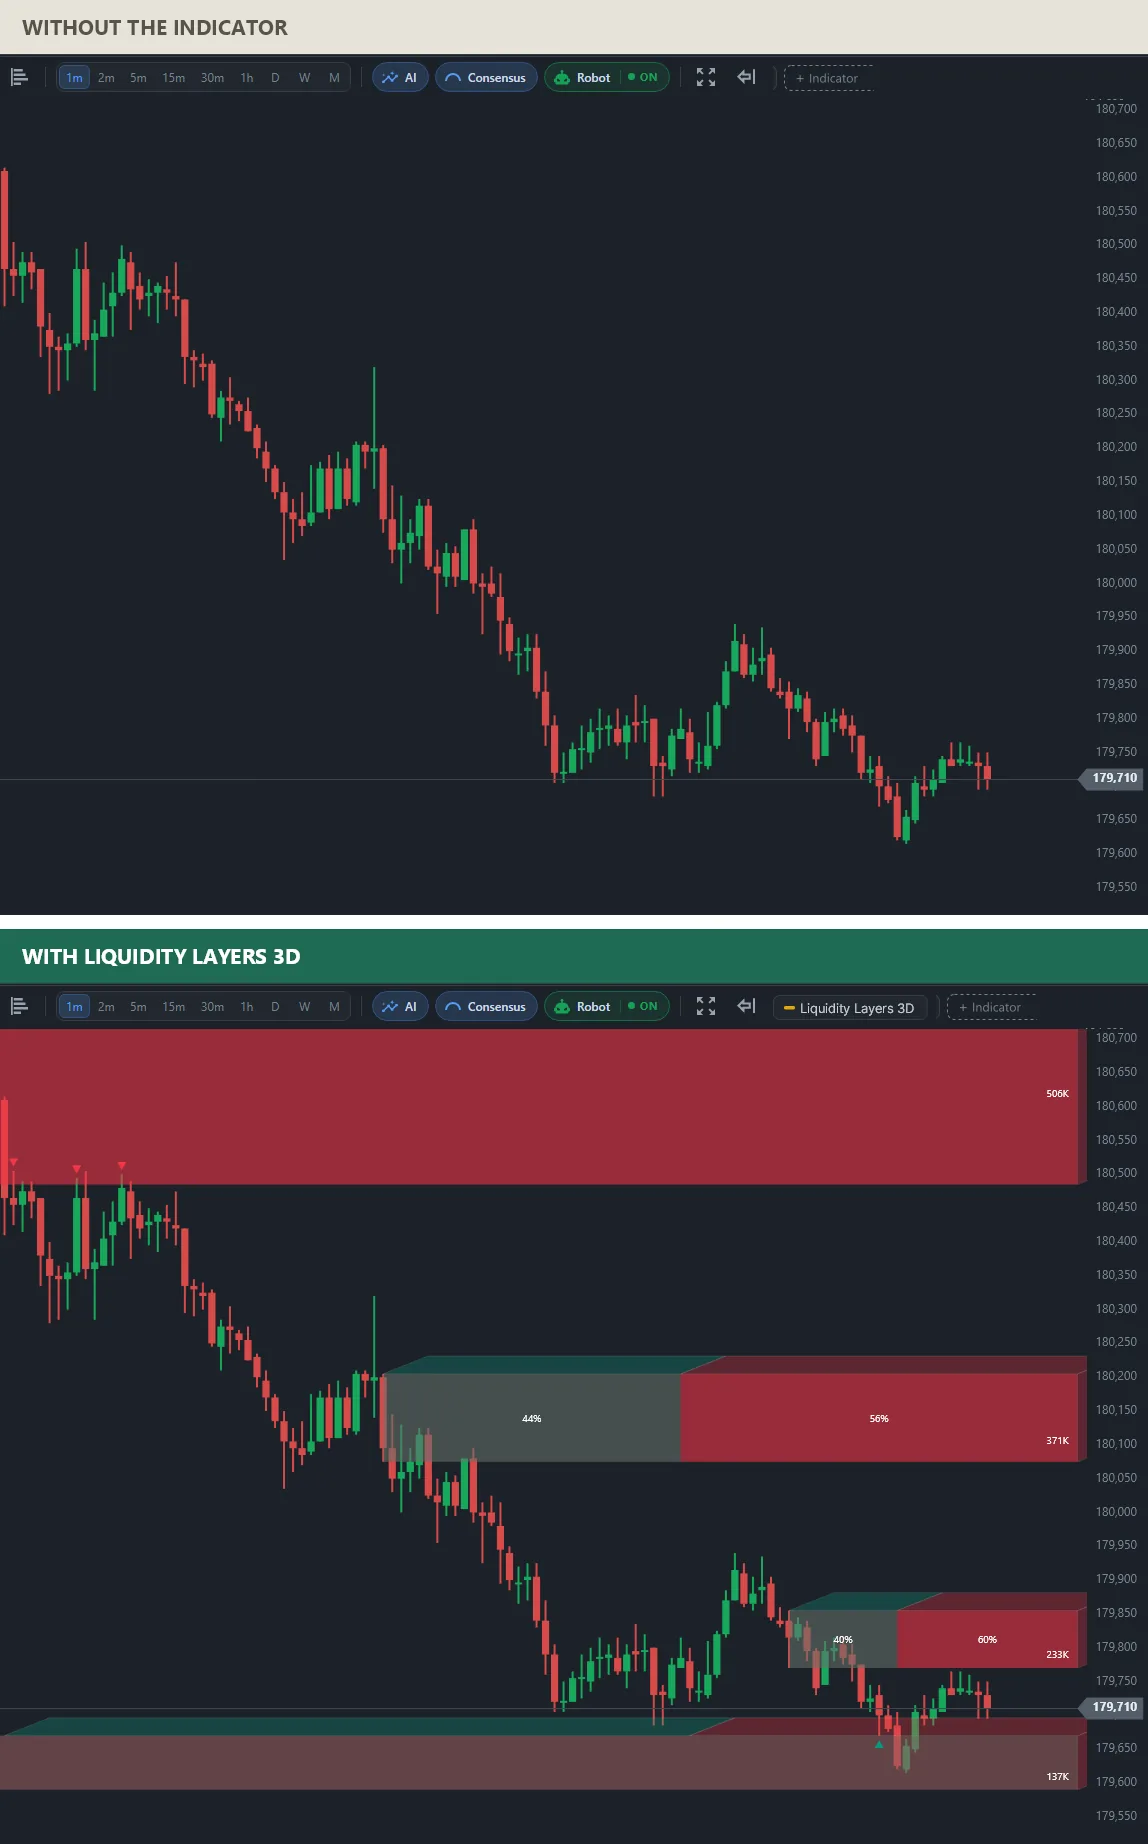
Here the layers sit above price, where the fall came from: one of 506K near 180,500–180,700, then 371K and 233K with sellers at 56% and 60%. The marks along the top show price returning to the highest layer and being turned away. At the bottom, price has just reached a layer below it, and a return mark appears there too.
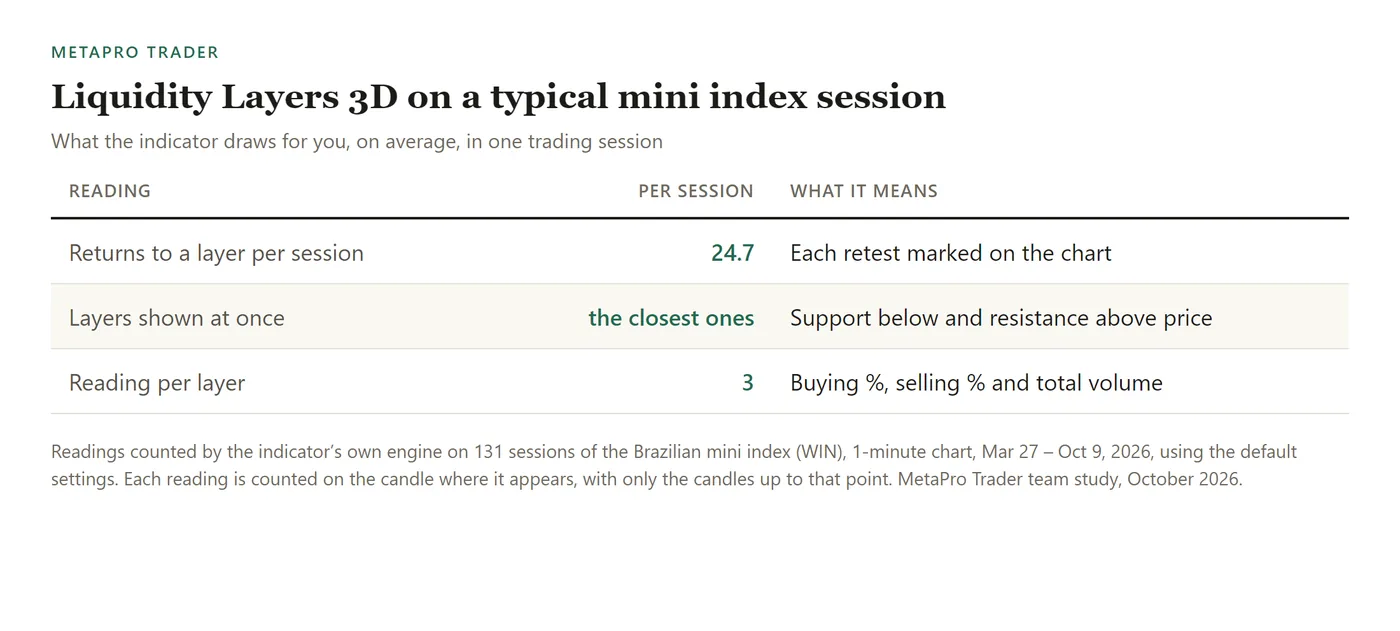
Order blocks and retests on a typical mini index session
Across 131 sessions of the Brazilian mini index (WIN), 1-minute chart, Mar 27 – Oct 9, 2026, price returned to a layer 24.7 times per session on average, and each return was marked on the chart. Only the layers closest to price are shown at once.
How to add the order block indicator to MT5
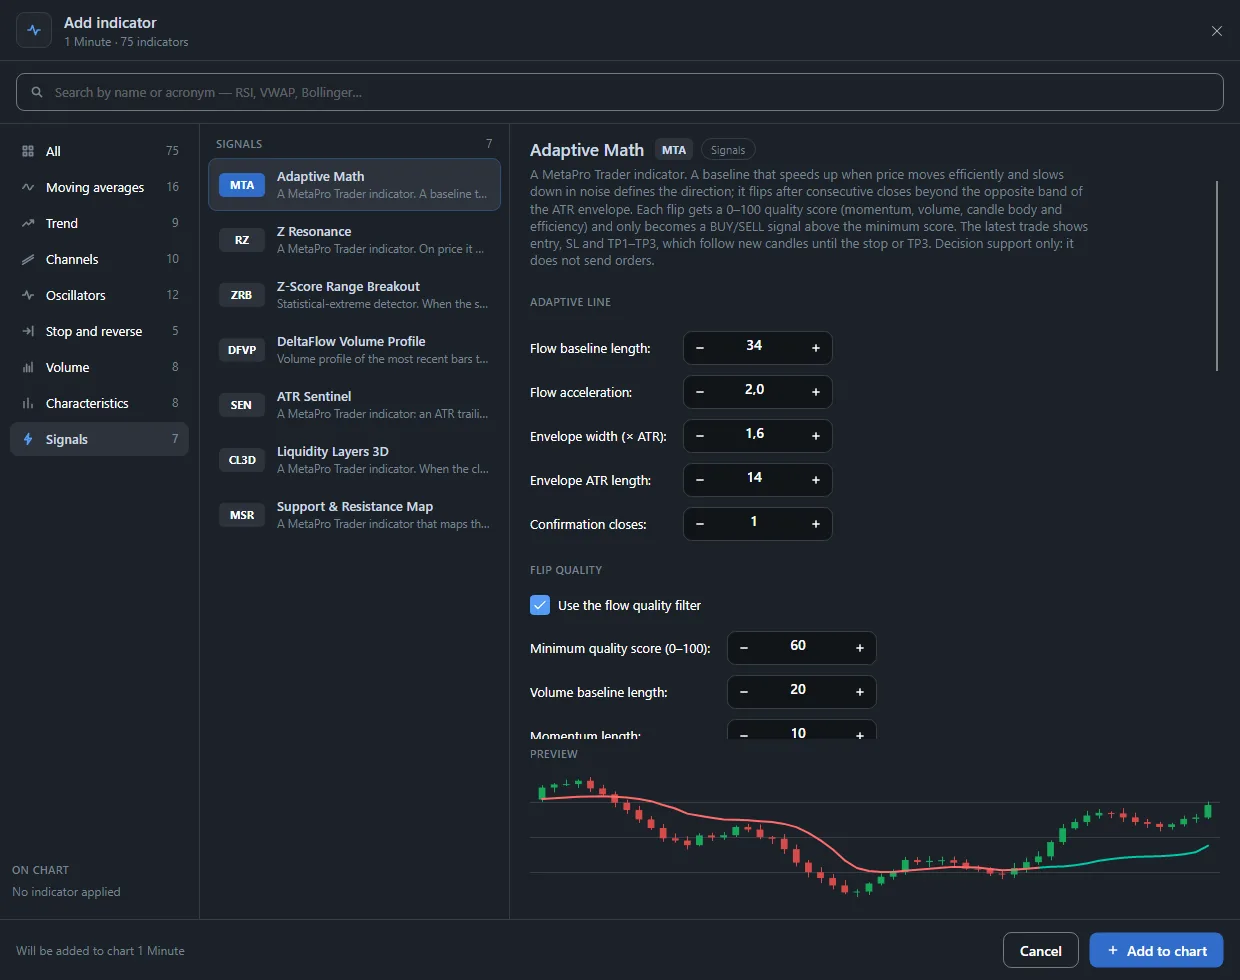
Connect your MT5 account in MetaPro Trader, open a chart, click + Indicator and choose Liquidity Layers 3D under Signals. Show fewer layers for a cleaner chart: the ones closest to price are the ones that matter now.
The MetaPro Trader team wrote this article using real mini index data. The indicator is a reading tool: it does not trade for you, past charts do not predict future ones, and trading carries risk of loss.
Learn more
- Order block indicator with volume for MT5
- Smart Money Concepts on MT5
- Volume profile for MT5 day trading
- The full list of MetaPro Trader indicators
- MetaPro Trader for MetaTrader 5
Keep reading
- A day trading bot for the mini index: how we test MetaPro Scalp V2 before it goes live
- The Market Breadth Radar MetaTrader 5 Doesn’t Have: Stocks, Dollar and Foreign Indices From Different Brokers on One Chart
- Automatic Fibonacci Indicator for MT5: Day Trading Levels and Targets That Draw Themselves
- Machine Learning Trading Indicator for MT5: AI That Keeps Its Own Score on Screen
- Automatic Stop Loss and Take Profit Indicator for MT5: Trade With the Plan on the Chart
- Buy and Sell Signal Indicator for MT5: See the Turn on the Exact Candle
- Divergence Indicator for MT5: See When a Move Is Running Out of Strength
- Range Breakout Indicator for MT5: Catch the Breakout the Moment It Happens
- Volume Profile Indicator for MT5 Day Trading: Follow the Money, Not Just the Price
- Intraday Support and Resistance Indicator for MT5: Start the Session With the Levels Drawn
- Smart Money Concepts Indicator for MT5: Market Structure the Way Professionals Read It
- Automatic Chart Pattern Indicator for MT5: Head and Shoulders, Triangles and Flags Found for You
- Automatic Support and Resistance Indicator for MT5, Scored From 0 to 100
- Buying and Selling Pressure Indicator for MT5: Who Is Running the Market Right Now
- Volume-Based Support and Resistance Indicator for MT5: Levels Confirmed by Real Trading
- Multi-Timeframe Candle Indicator for MT5: The Daily Candle on Your 1-Minute Chart