Tools
The Market Breadth Radar MetaTrader 5 Doesn’t Have: Stocks, Dollar and Foreign Indices From Different Brokers on One Chart
Connect several brokers at once and watch the Ibovespa heavyweights, the dollar and the S&P 500 move with your mini index, live, in one card that answers in one word: aligned, split or alone.
Is the rest of the market buying too?
The mini index has just broken the morning high. The candle is big and green and the order ticket is one click away. Before clicking, an experienced trader asks a question the chart cannot answer: is the rest of the market buying too?
An index is a basket. When Itaú, Vale and Petrobras are all rising, a breakout has company. When one stock is carrying the index while the others drift lower, the same green candle means something else. Answering that used to take a second monitor full of tickers. MetaPro Trader’s Radar puts the answer on the chart itself: a small card that follows a list of assets you choose and tells you, in one word, whether your chart is moving with them.
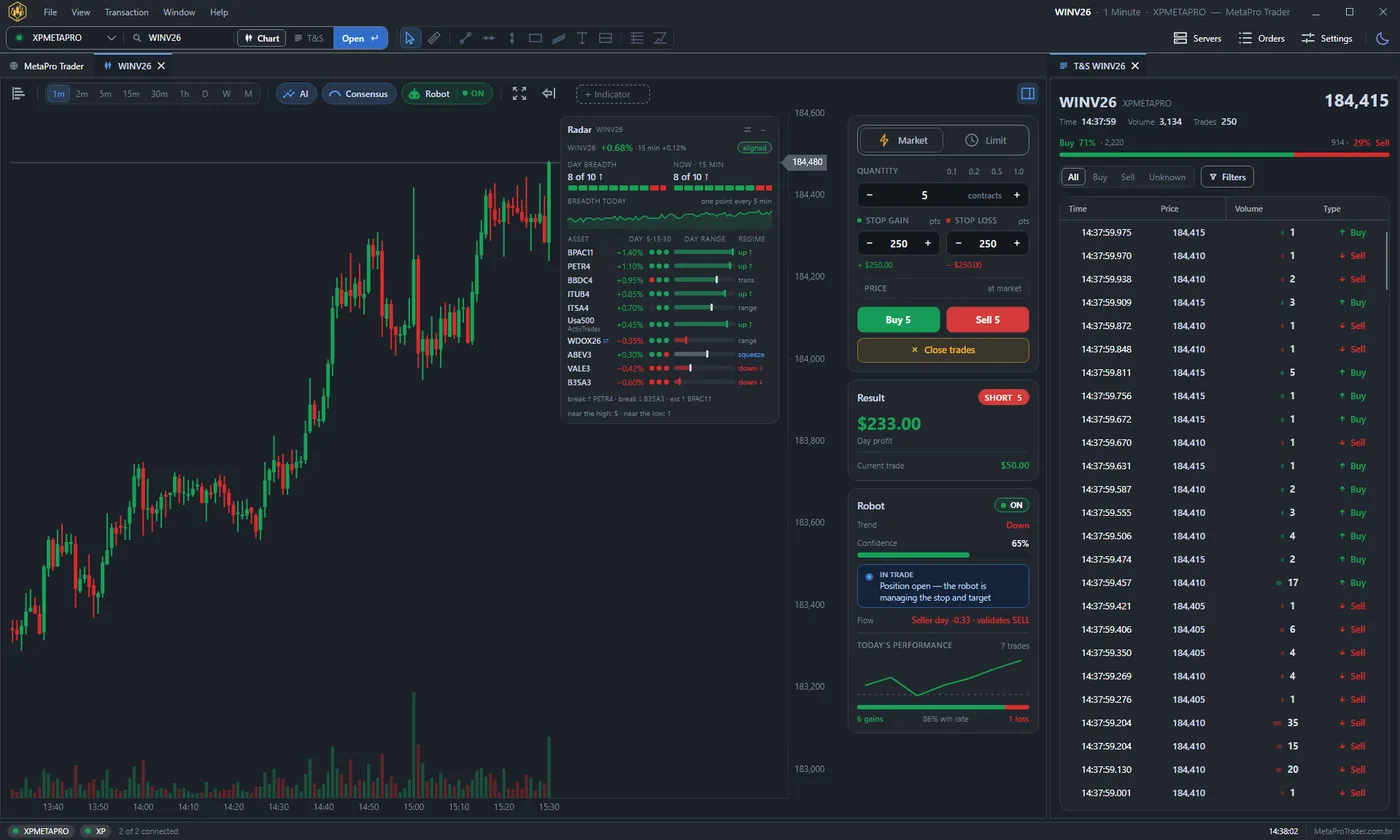
The Radar is one of the tools of MetaPro Trader, an AI day trading platform that connects straight to your MetaTrader 5 account. It lives in the chart window, next to the AI, the Consensus panel, the order book and the robot, and it reads only what your connected accounts already receive.
How to open the market breadth Radar on your MT5 chart
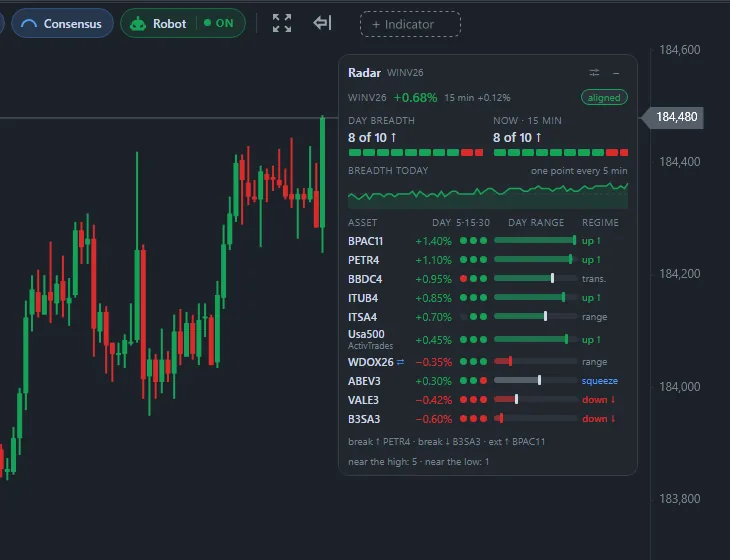
The Radar has its own button at the left end of the chart toolbar, right next to the order book button. One click opens the card over the chart; another click closes it. The minus sign in the card’s header collapses it to a single line, and you can drag it by the header to any corner, so it never has to sit on the candles you are reading.

On the mini index, the card opens with a ready list: the ten stocks with the largest weight in the Ibovespa theoretical portfolio of October 7, 2026, which together make up 54.84% of the index: ITUB4, VALE3, PETR4, PETR3, AXIA3, BBDC4, B3SA3, SBSP3, ITSA4 and BPAC11. For any other asset the list starts empty and you build your own in a few seconds.
Aligned, split or alone: the one-word answer
The badge in the card’s header compares the last 15 minutes of your chart with the last 15 minutes of the list. If your chart is rising and most of the list is rising too, it says aligned. If the list is divided, it says split. If your chart is going one way and most of the list the other way, it says alone. And when the chart has barely moved, the badge says flat instead of forcing a verdict.
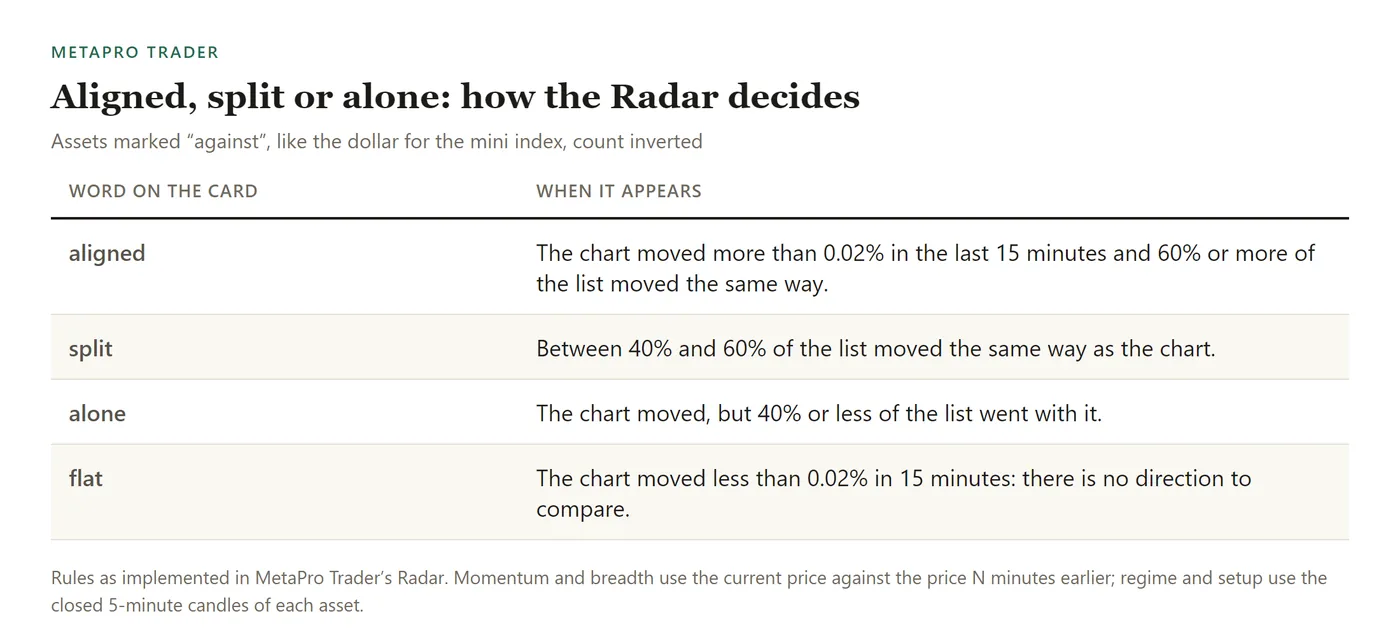
Some assets naturally move against your chart. For the mini index, the dollar is the classic case: a falling dollar usually goes with a rising stock market. Mark such an asset as against and the Radar counts it inverted everywhere, in the badge, in the breadth and in the colors. A falling dollar then counts as a vote for the index going up.
Reading the Thermometer, part by part
The Thermometer is the default view and the most complete one. Here it is with each part numbered.
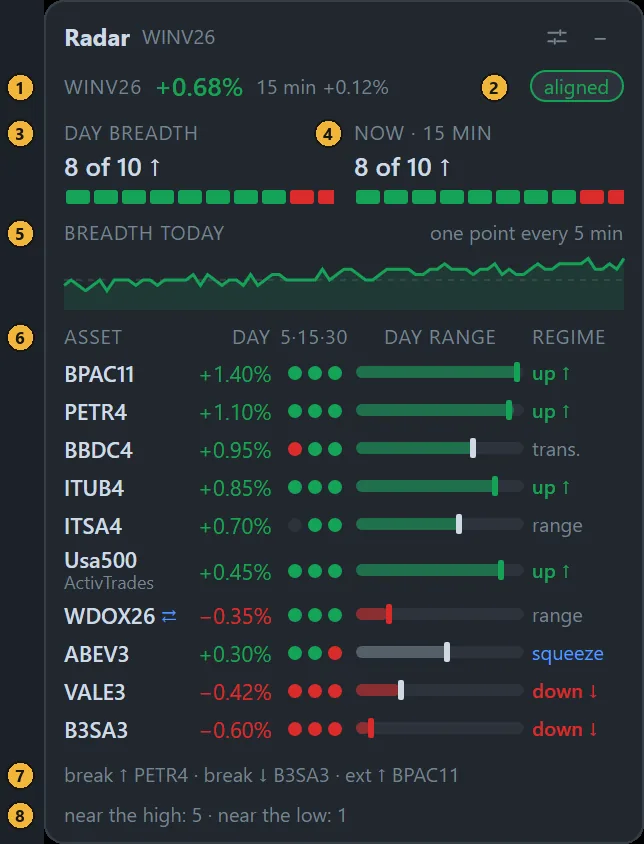
- Your chart. The chart’s asset, its change on the day and over the last 15 minutes.
- The verdict. Aligned, split, alone or flat, as described above.
- Day breadth. How many assets on the list are up on the day, “8 of 10 ↑”, with one block per asset: green for up, red for down.
- Now · 15 min. The same count over the last 15 minutes. The day can still be green while the last quarter of an hour is turning, and this is where you see it first.
- Breadth today. The share of the list that was up, one point every 5 minutes since the open. A line drifting down while the index holds its high says the move is getting thinner.
- One row per asset, from the strongest to the weakest for your chart: the change on the day; three momentum dots for the last 5, 15 and 30 minutes (green up, red down, dim when flat); the position in the day’s range, from the low on the left to the high on the right; and the asset’s regime.
- Setups. The assets that just broke out, pulled back, stretched or turned, listed by name.
- Near the extremes. How many assets are in the top 20% of their day’s range and how many are in the bottom 20%.
What the regime and setup labels mean
Each asset’s regime and setup come from its own closed 5-minute candles, with fixed rules, so the same candles always give the same label. These are the rules exactly as the platform applies them.
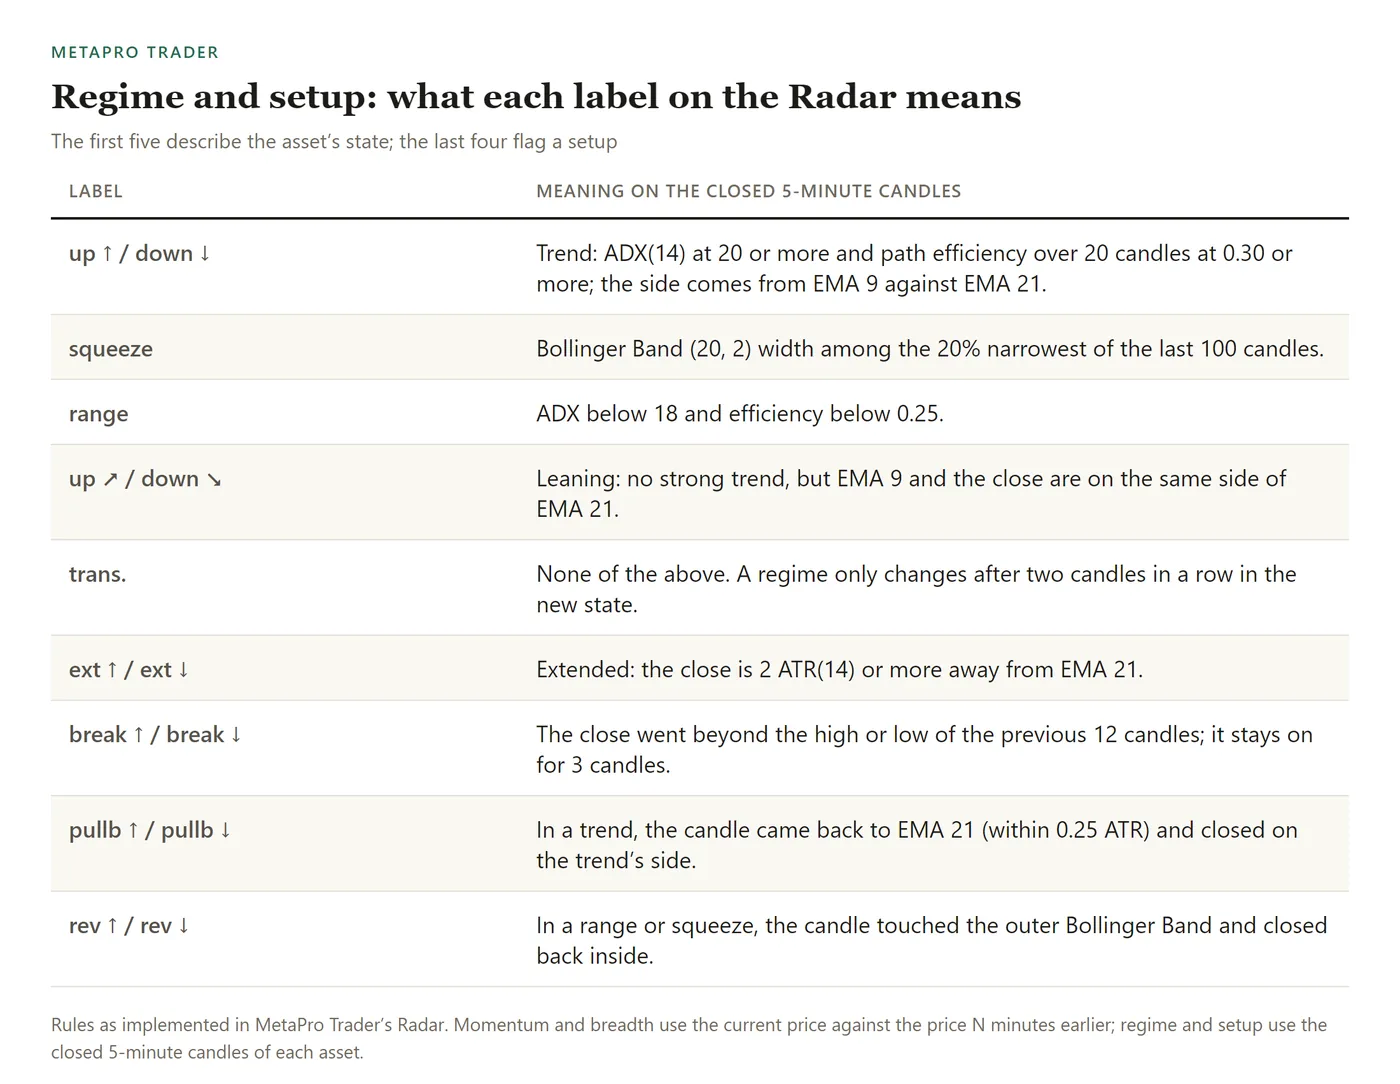
The regimes describe each asset’s state; the setups flag something that just happened. A breakout on PETR4 while the index is still under its high, or three of the ten stocks stretched at the same time, are the details that are hard to catch by flipping between charts.
Heat map: the whole list at a glance
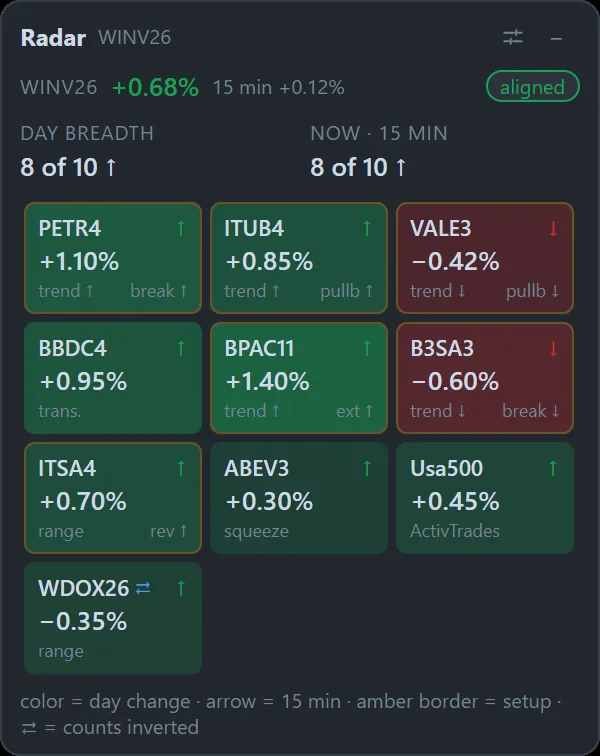
The Heat map trades detail for speed. Each asset is a block that stays in the same place, so your eye learns where to look. The color shows the change on the day, the small arrow the last 15 minutes and an amber border means the asset has a setup. The legend at the bottom spells it out, and the ⇄ symbol marks the assets counted inverted, like the dollar contract in the example. It is the view for reading the market’s mood in under a second.
Who is pulling: the assets carrying your chart
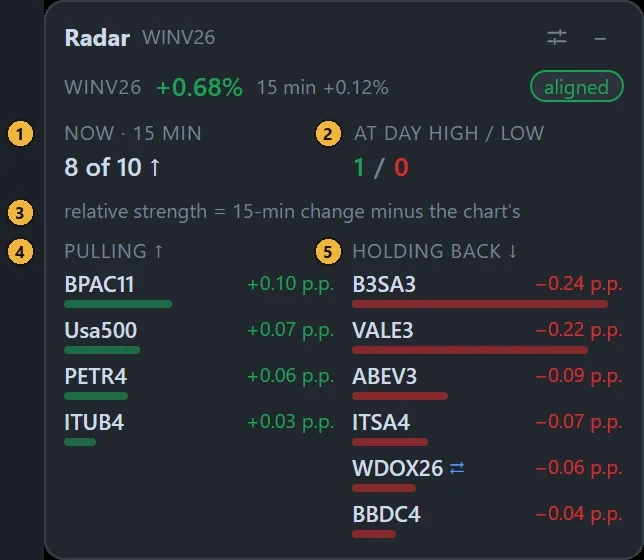
The third view answers the most direct question: right now, which assets are stronger than my chart and which are weaker?
- Now · 15 min. The breadth of the last 15 minutes, as in the Thermometer.
- At day high / low. How many assets are at the very edge of their range, in the top or bottom 5%.
- Relative strength. Each asset’s 15-minute change minus your chart’s 15-minute change, in percentage points.
- Pulling. The assets beating your chart, strongest first.
- Holding back. The assets lagging behind it, weakest first.
In the example, BPAC11 is pulling with +0.10 p.p. while B3SA3 and VALE3 hold back with −0.24 and −0.22 p.p. A rally carried by a few names while heavyweights lag is a different market from one where the whole list pushes together, even when the index candle looks the same.
Build your own list, from any connected broker
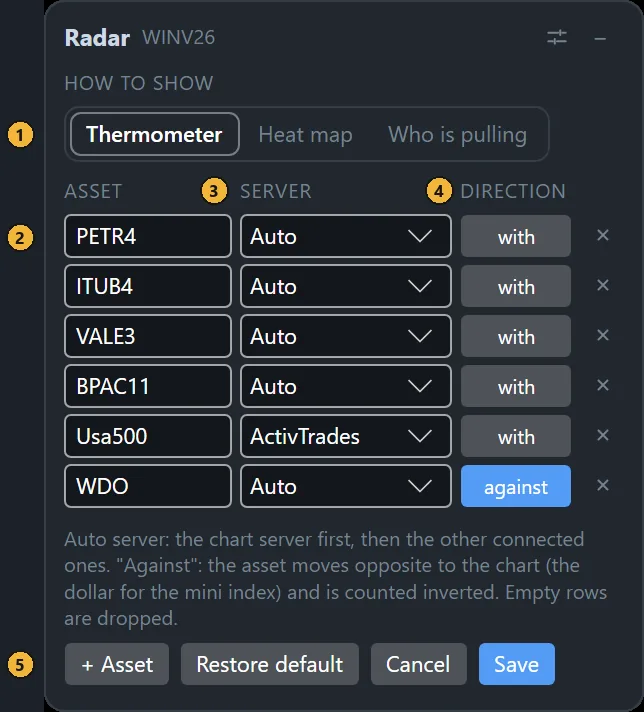
The settings button in the card’s header opens the editor:
- How to show. Thermometer, Heat map or Who is pulling.
- The list. Up to 20 assets. Type the name as your broker writes it; for B3 futures you can type just the root, such as WDO, and the Radar uses the current contract.
- Server. Auto looks for the asset on the chart’s server first and then on your other connected servers. You can also pin a server, which is how the example puts the US 500 from another broker next to Brazilian stocks.
- Direction. With or against, as explained above.
- Buttons. “+ Asset” adds a row, “Restore default” brings back the original list and “Save” keeps your changes.
The list is saved per base asset: the October and December mini index contracts share the same list, so a contract rollover does not cost you your setup.
Three ways to put the Radar to work
- Before a breakout. Look at Now · 15 min and the badge. A breakout marked aligned has the list behind it; one marked alone is one asset moving by itself, and that is when many traders prefer to wait for confirmation.
- At the day’s high. Count how many assets are near their own high. A new index high with only one or two stocks near theirs is a thin move.
- With the dollar on the list. Add WDO marked against. When the index rises and the dollar falls, the two markets agree; when both rise together, the index is moving without the dollar’s help.
Light on your connection, by design
MetaTrader 5 gives each account a single connection, and a reading tool should never compete with your orders. The Radar only reads servers you already have connected: it never opens a new connection and never asks for a two-factor code. It requests one batch of quotes per second per server, downloads each asset’s history once a day and builds its 5-minute candles locally. It only reads: it does not send orders and does not change what your robot does.
This article was written by the MetaPro Trader team. The Radar images use illustrative numbers to show how the card reads; the rules in the tables are the ones the platform applies. The Radar is a reading tool: it does not send orders and does not predict prices, and trading carries risk of loss.
Learn more
- The Radar on the MetaPro Trader website
- Manual: how to use the Radar
- Intraday support and resistance for MT5
- Buying and selling pressure in percent
- MetaPro Trader: AI day trading platform for MT5
Keep reading
- A day trading bot for the mini index: how we test MetaPro Scalp V2 before it goes live
- Automatic Fibonacci Indicator for MT5: Day Trading Levels and Targets That Draw Themselves
- Machine Learning Trading Indicator for MT5: AI That Keeps Its Own Score on Screen
- Automatic Stop Loss and Take Profit Indicator for MT5: Trade With the Plan on the Chart
- Buy and Sell Signal Indicator for MT5: See the Turn on the Exact Candle
- Divergence Indicator for MT5: See When a Move Is Running Out of Strength
- Range Breakout Indicator for MT5: Catch the Breakout the Moment It Happens
- Volume Profile Indicator for MT5 Day Trading: Follow the Money, Not Just the Price
- Order Block Indicator With Volume for MT5: Find Where the Big Moves Came From
- Intraday Support and Resistance Indicator for MT5: Start the Session With the Levels Drawn
- Smart Money Concepts Indicator for MT5: Market Structure the Way Professionals Read It
- Automatic Chart Pattern Indicator for MT5: Head and Shoulders, Triangles and Flags Found for You
- Automatic Support and Resistance Indicator for MT5, Scored From 0 to 100
- Buying and Selling Pressure Indicator for MT5: Who Is Running the Market Right Now
- Volume-Based Support and Resistance Indicator for MT5: Levels Confirmed by Real Trading
- Multi-Timeframe Candle Indicator for MT5: The Daily Candle on Your 1-Minute Chart