Indicators
Automatic Fibonacci Indicator for MT5: Day Trading Levels and Targets That Draw Themselves
Fibonacci Delta Projection redraws the retracements, projects the next targets and shows the buying and selling inside each Fibonacci zone of the mini index.
The three questions after every strong move
It is 11:30 on September 10, and the Brazilian mini index has just rallied more than 2,000 points since the morning low. Price is sitting a few ticks under the high. Every day trader looking at that chart is asking the same three questions: if it pulls back, where can the pullback stop? Where is the next target? And did buyers really commit to this move, or did it just float up?
On a plain chart, answering those questions means finding the low, finding the high, dragging a Fibonacci tool, guessing which levels matter and redoing it all when the market prints a new extreme. By the time it is drawn, the trade is gone. Fibonacci Delta Projection answers all three on its own, the moment the candle closes.
Every scene in this article was drawn in MetaPro Trader, an AI day trading platform that connects straight to your MetaTrader 5 account. Its artificial intelligence is prepared for each asset and each timeframe: before it marks a single pattern, it downloads that asset’s own history and maps how its patterns behave there. The AI on the mini index is not a copy of the AI on the dollar. Chart, Consensus AI, order flow, order ticket and robot all live in one window.
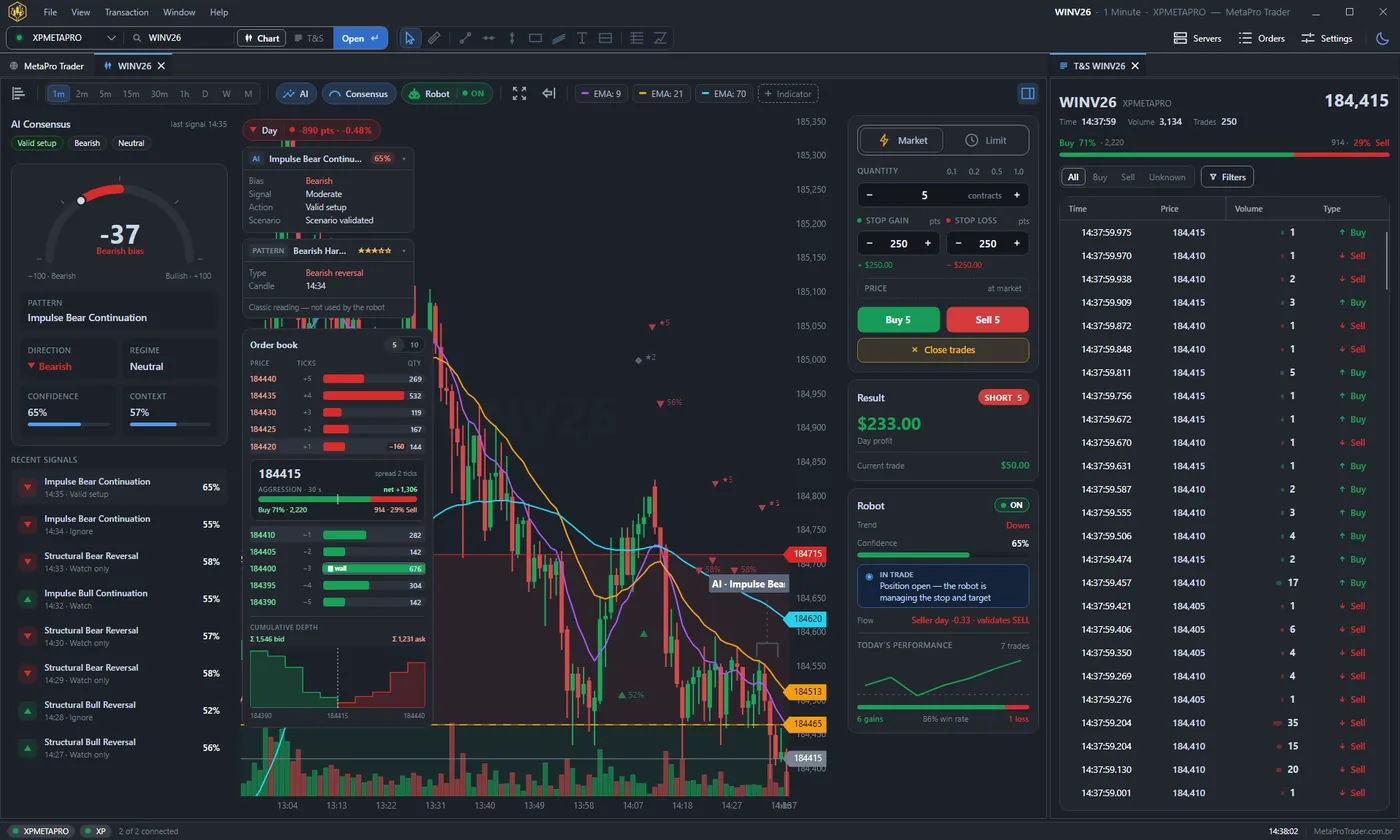
Scene 1: a strong rally, and the question of the pullback
Here is that exact moment, twice. On top, the chart as most traders see it. Below, the same candles with Fibonacci Delta Projection added.
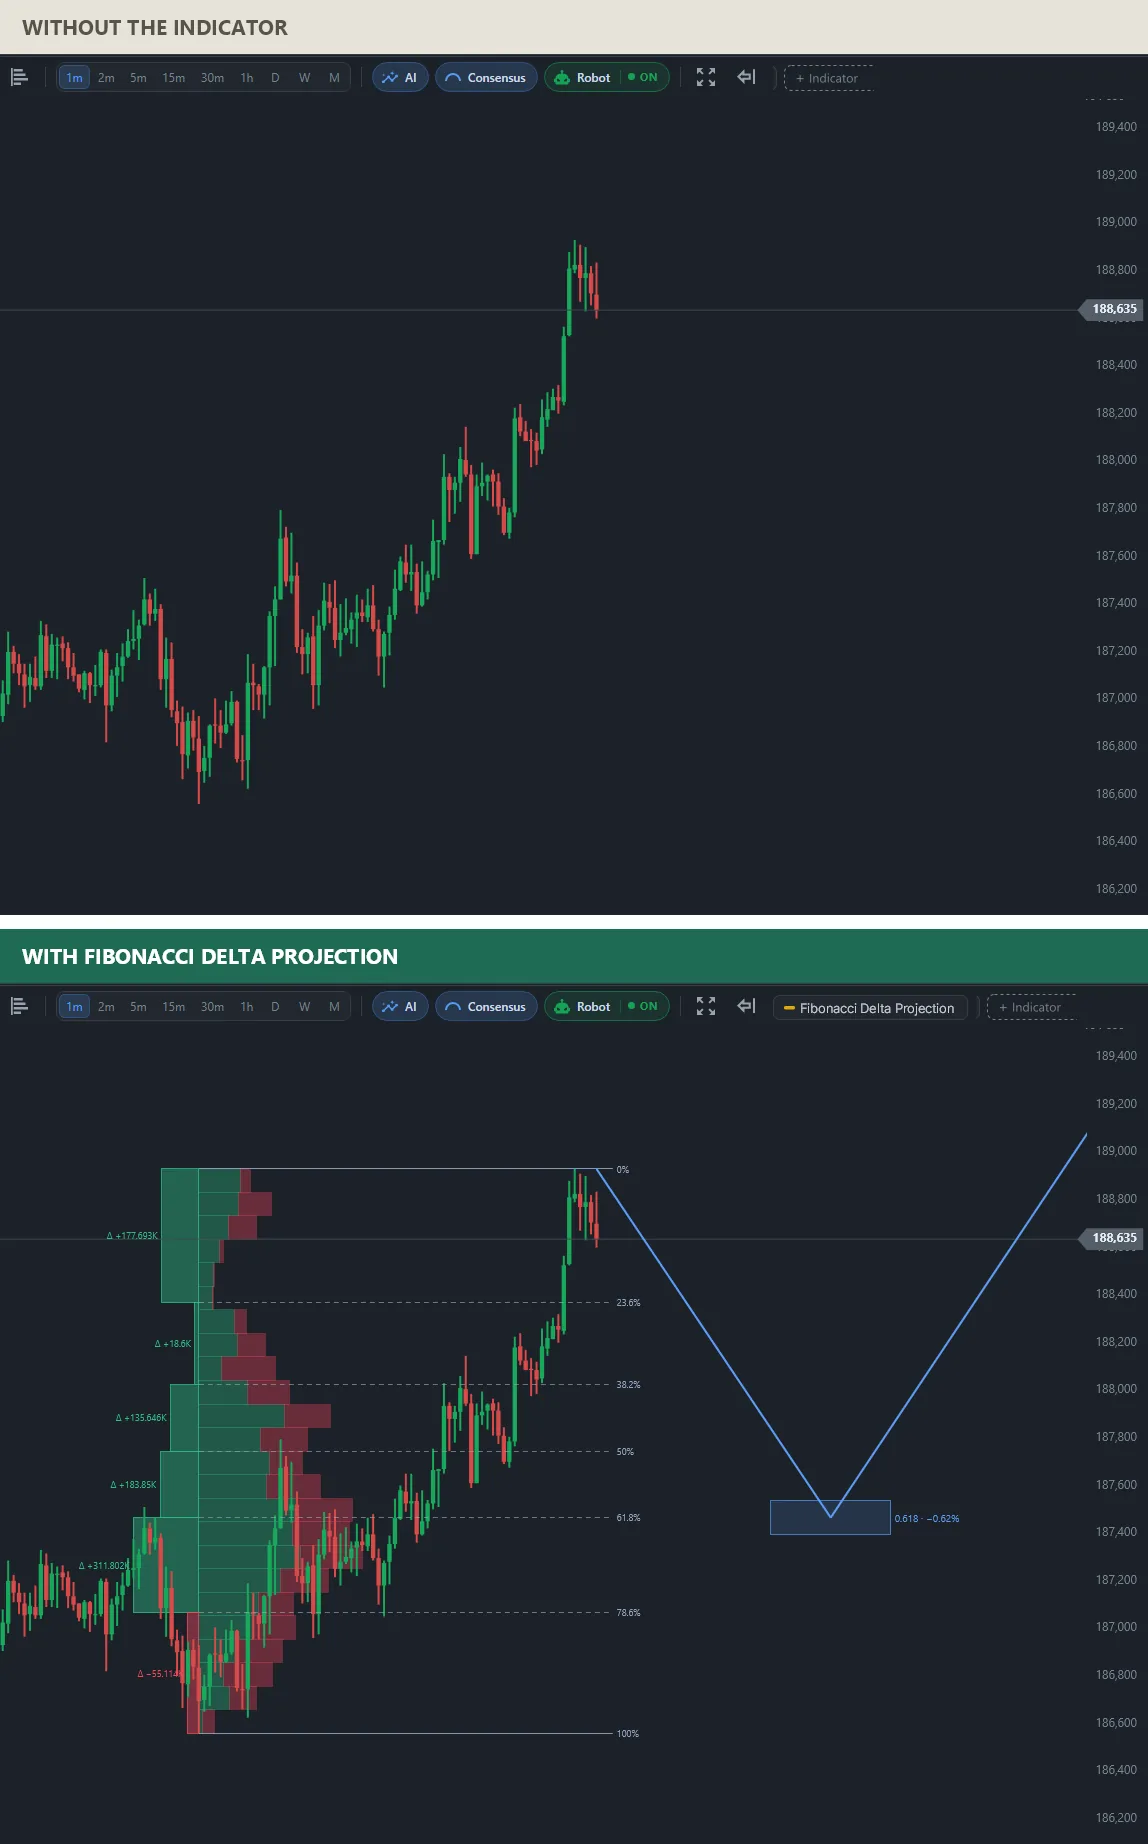
Without the indicator there is a rally and nothing else. With it, the whole leg is mapped:
- The retracements of the move are drawn from the morning low (100%) to the high (0%), with 23.6%, 38.2%, 50%, 61.8% and 78.6% in between.
- The delta of each Fibonacci zone shows where buyers did the work: the bands between 38.2% and 78.6% carry the biggest buying balances of the leg, so a pullback into that area is a pullback into the zone buyers defended.
- The projected path marks the pullback target at 61.8%, with the distance from the current price written next to it: −0.62%.
Three questions, three answers, and not a single line drawn by hand.
Scene 2: a falling market and a bounce
The tool works the same way when the market falls. On September 4 at 10:45 the mini index had dropped from 188,100 to 185,500 and was bouncing. The question flips: how far can this bounce go before sellers return?
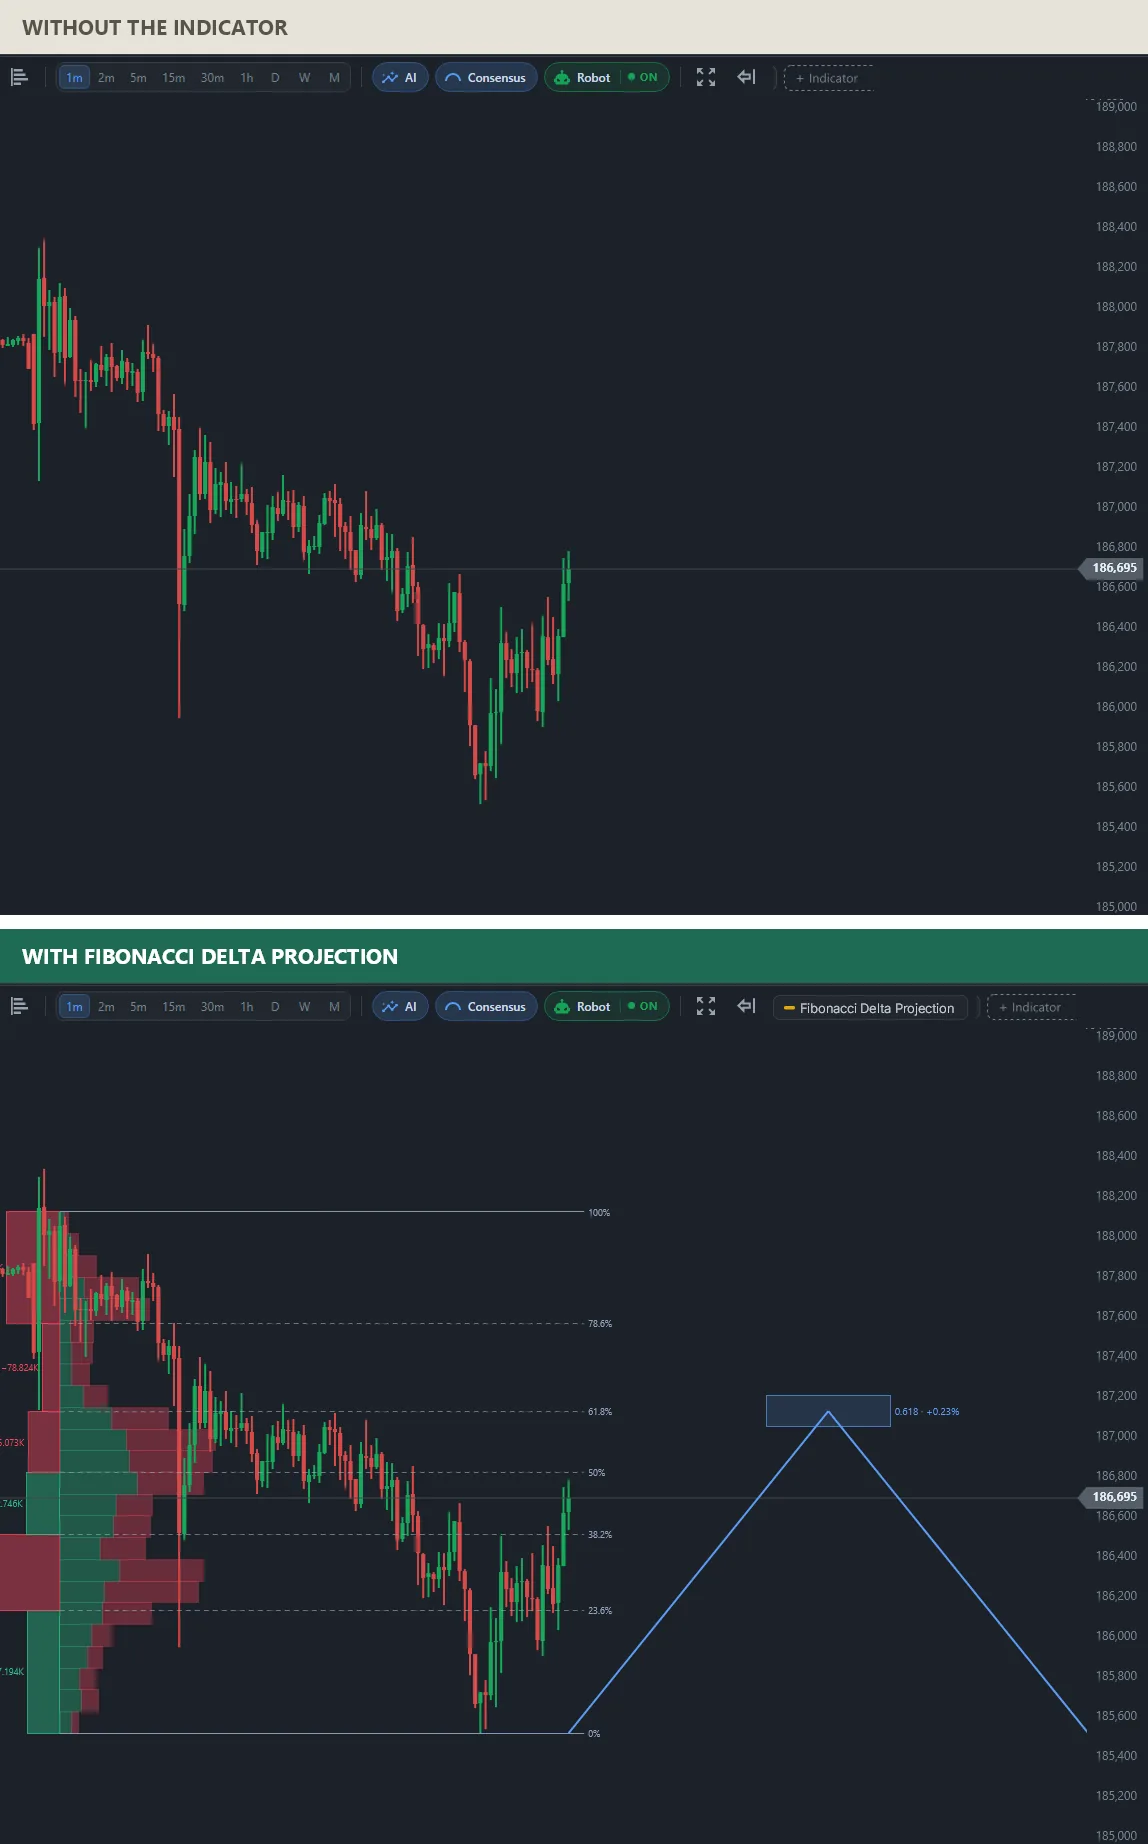
On the plain chart the bounce looks like it could go anywhere. With Fibonacci Delta Projection, the leg is measured from its high to its low, the price is already between the 38.2% and 50% levels, and the projected bounce target sits at 61.8%, only +0.23% away. The red bands at the top of the leg show where selling was heavy: that is the zone the bounce is walking into.
Scene 3: levels that follow the market
The routine that wears traders out is not drawing Fibonacci once. It is redrawing it every time the market makes a new high or a new low. On August 27 the mini index kept stretching higher all afternoon, and every new high moved the 0% line up with it, along with every retracement and the projected target.
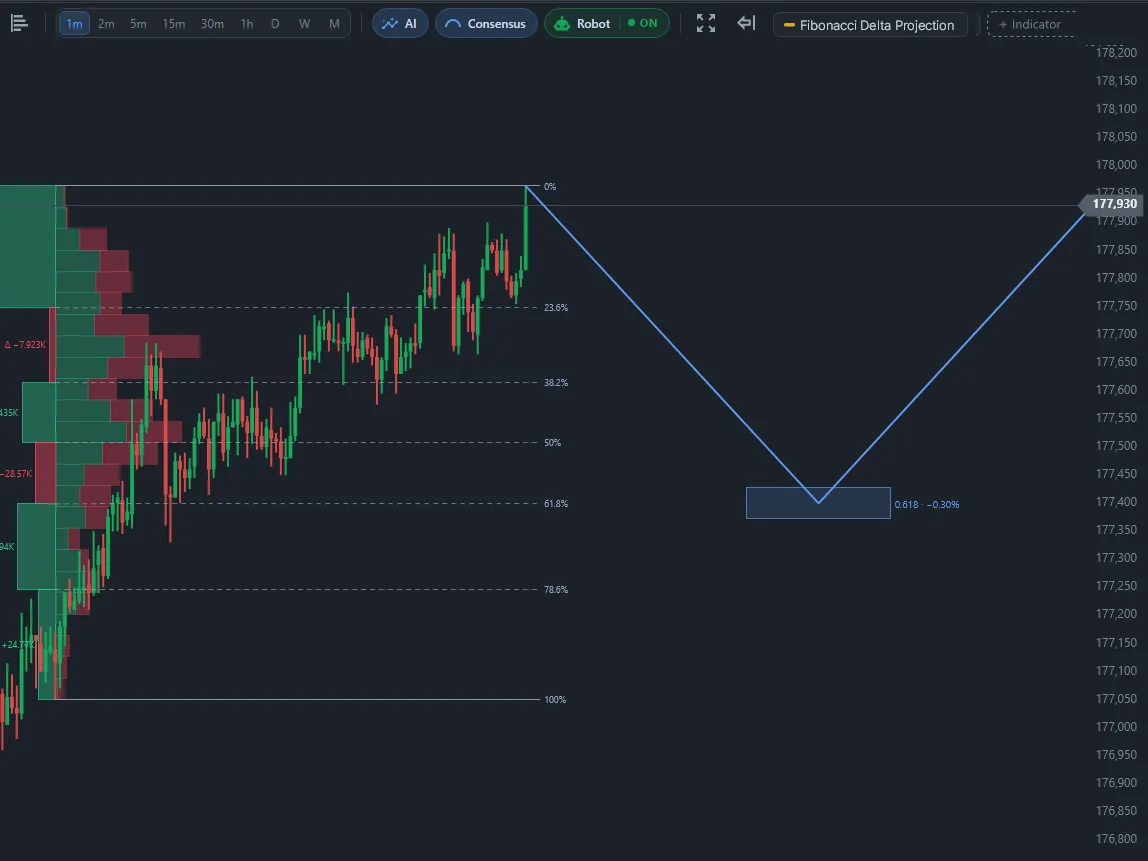
What it draws on a typical mini index day trading session
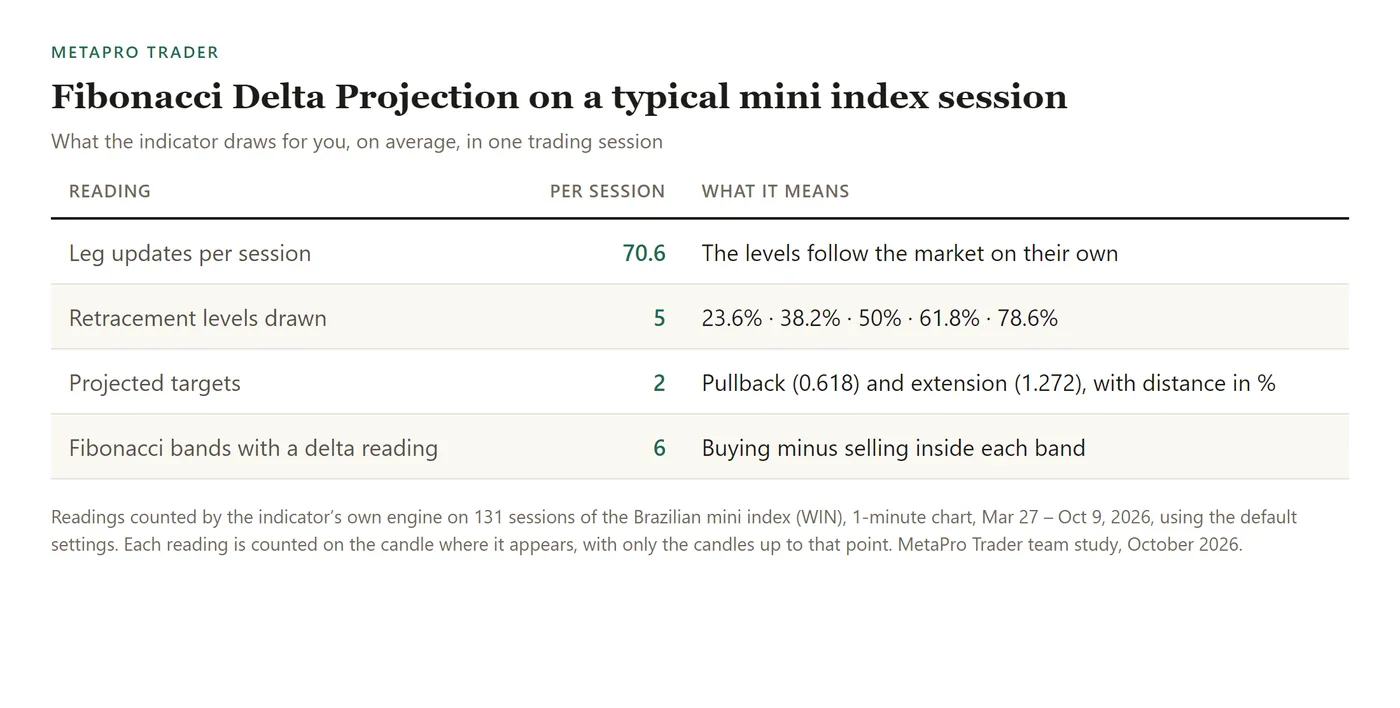
We ran Fibonacci Delta Projection over 131 sessions of the mini index on the 1-minute chart and counted what it puts on the screen. On an average session, the leg updates itself about 70 times, which is 70 times you would otherwise redraw the tool by hand.
An automatic Fibonacci indicator that does not repaint
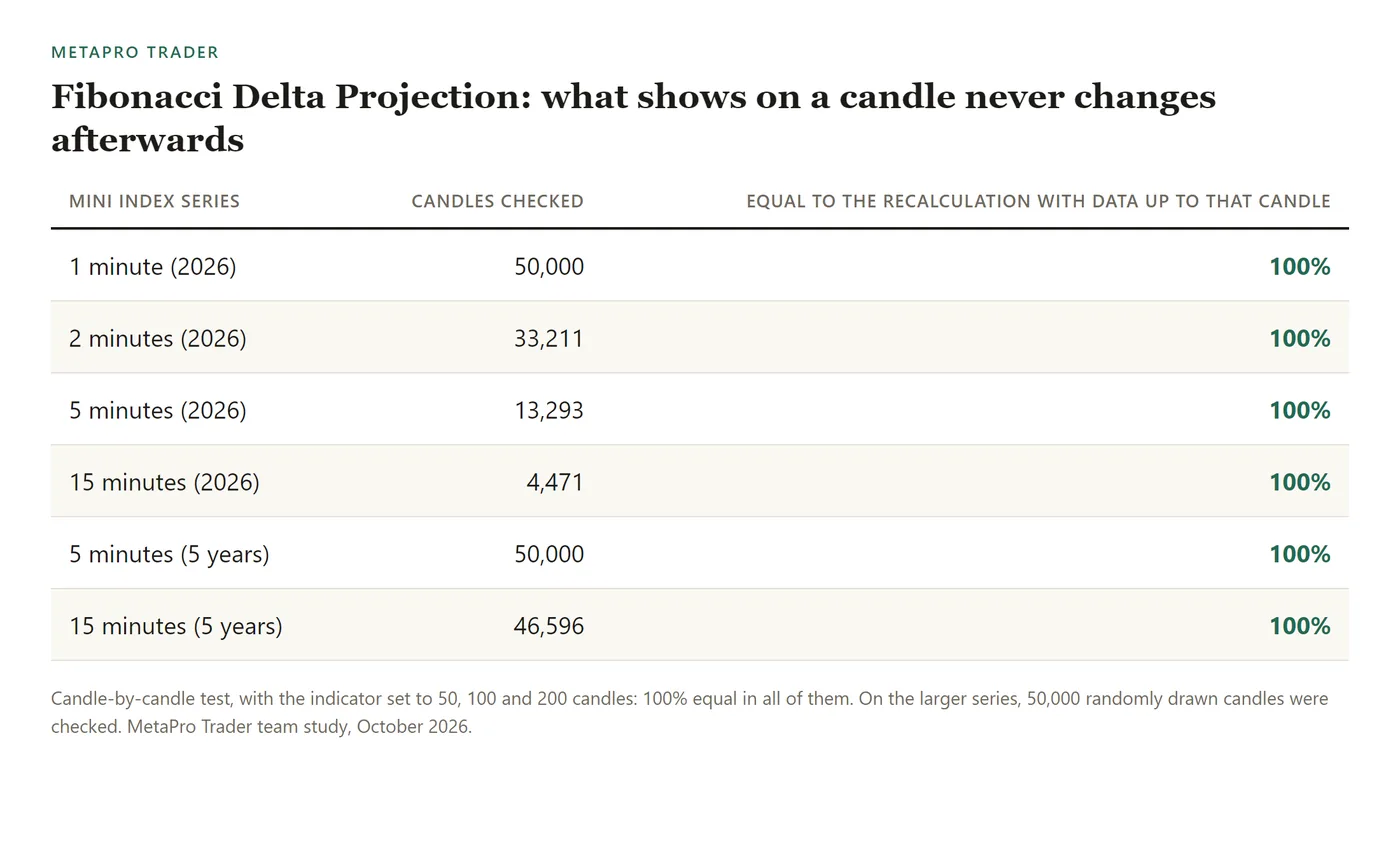
A tool that redraws itself raises a fair question: will the level that was there when I entered still be there later? We fed the indicator the mini index history one candle at a time, across six series, and compared what it showed on every candle with an independent recalculation using only the candles up to that moment. It matched 100% on every series. What you see on a candle is what the indicator showed at that candle, and it does not change afterwards.
How to add the automatic Fibonacci indicator to MT5
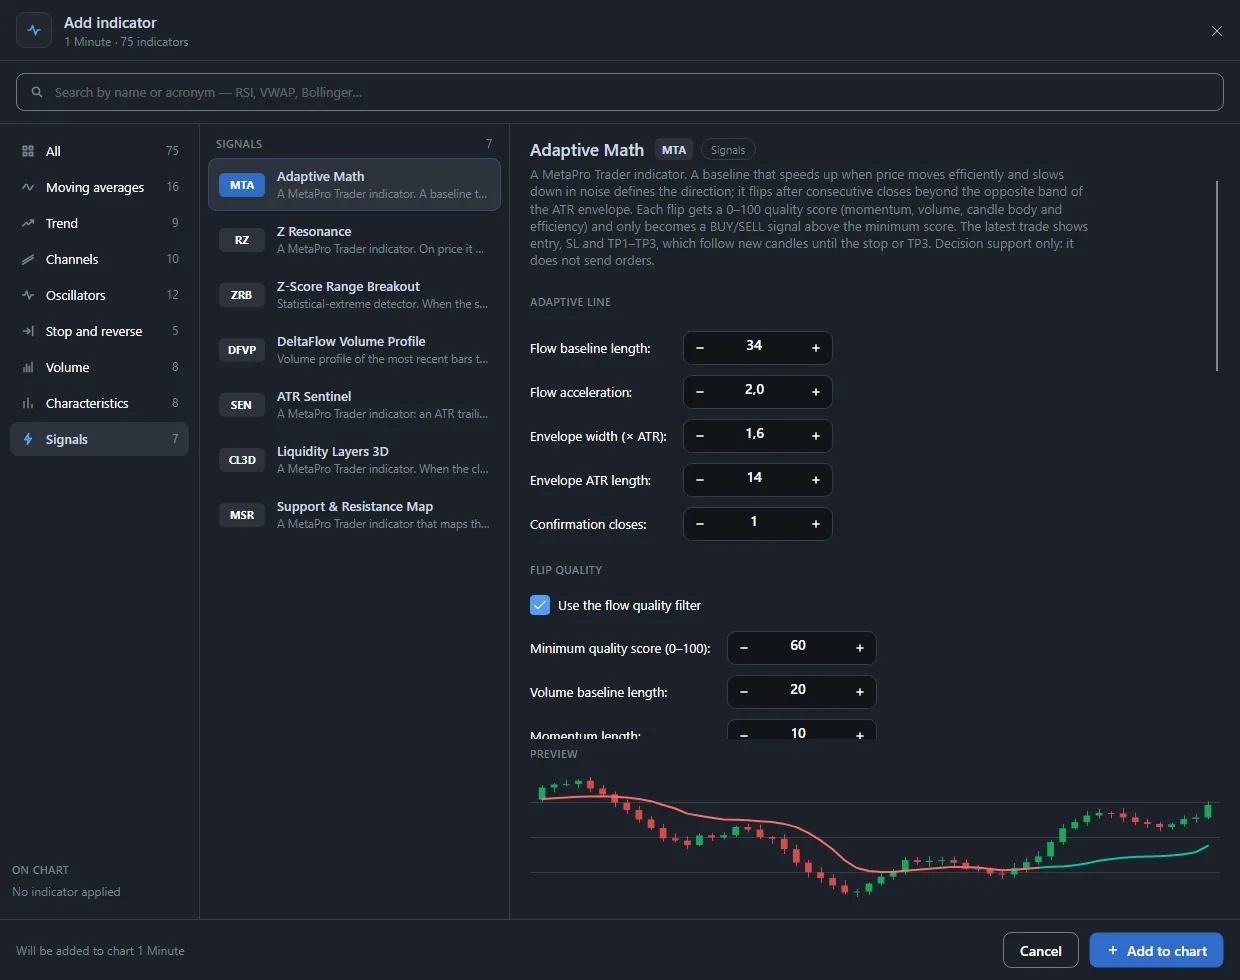
Connect your MetaTrader 5 account in MetaPro Trader, open the chart of the asset, click + Indicator, open the Signals tab and pick Fibonacci Delta Projection. The defaults are the ones used in the scenes above. Fewer leg candles (50) follow short moves; more (200) show the structure of the whole session.
This article was written by the MetaPro Trader team. The charts are real mini index sessions drawn by the indicator’s own engine. Trading in financial markets involves risk of loss; the indicator helps you read the chart and does not send orders, and nothing here is investment advice.
Learn more
- Automatic Fibonacci with targets for MT5
- Automatic support and resistance, scored 0 to 100
- Volume profile for MT5 day trading
- All day trading indicators for MT5
- MetaPro Trader: AI day trading platform for MT5
Keep reading
- A day trading bot for the mini index: how we test MetaPro Scalp V2 before it goes live
- The Market Breadth Radar MetaTrader 5 Doesn’t Have: Stocks, Dollar and Foreign Indices From Different Brokers on One Chart
- Machine Learning Trading Indicator for MT5: AI That Keeps Its Own Score on Screen
- Automatic Stop Loss and Take Profit Indicator for MT5: Trade With the Plan on the Chart
- Buy and Sell Signal Indicator for MT5: See the Turn on the Exact Candle
- Divergence Indicator for MT5: See When a Move Is Running Out of Strength
- Range Breakout Indicator for MT5: Catch the Breakout the Moment It Happens
- Volume Profile Indicator for MT5 Day Trading: Follow the Money, Not Just the Price
- Order Block Indicator With Volume for MT5: Find Where the Big Moves Came From
- Intraday Support and Resistance Indicator for MT5: Start the Session With the Levels Drawn
- Smart Money Concepts Indicator for MT5: Market Structure the Way Professionals Read It
- Automatic Chart Pattern Indicator for MT5: Head and Shoulders, Triangles and Flags Found for You
- Automatic Support and Resistance Indicator for MT5, Scored From 0 to 100
- Buying and Selling Pressure Indicator for MT5: Who Is Running the Market Right Now
- Volume-Based Support and Resistance Indicator for MT5: Levels Confirmed by Real Trading
- Multi-Timeframe Candle Indicator for MT5: The Daily Candle on Your 1-Minute Chart