Robots
A day trading bot for the mini index: how we test MetaPro Scalp V2 before it goes live
A trading robot for MT5 that reaches your account only after passing the same test it will execute.
A robot that has to pass its own test first
Anyone who has shopped for a day trading bot knows the scene. The backtest shows a curve that only goes up, the seller talks about a high win rate, and the live account tells a different story. Most of the time the problem is the simulation: it knew things the robot could not know in real time.
We ran into this in our own lab. That is how MetaPro Scalp V2 was born: first we fixed the measuring stick, then we used it to pick the strategy.
The day our backtest got worse, and better
While reviewing the MetaPro Trader strategy lab, we found two places where the simulation was more optimistic than the market. In the first, the order was placed using information that only exists after the candle closes. In the second, the simulation kept several orders waiting at once, while the real robot works with one at a time.
We fixed both. The lab's numbers went down, and they started measuring what the robot can actually do in your account. Every MetaPro Scalp V2 analysis runs on that corrected measuring stick.
What MetaPro Scalp V2 is
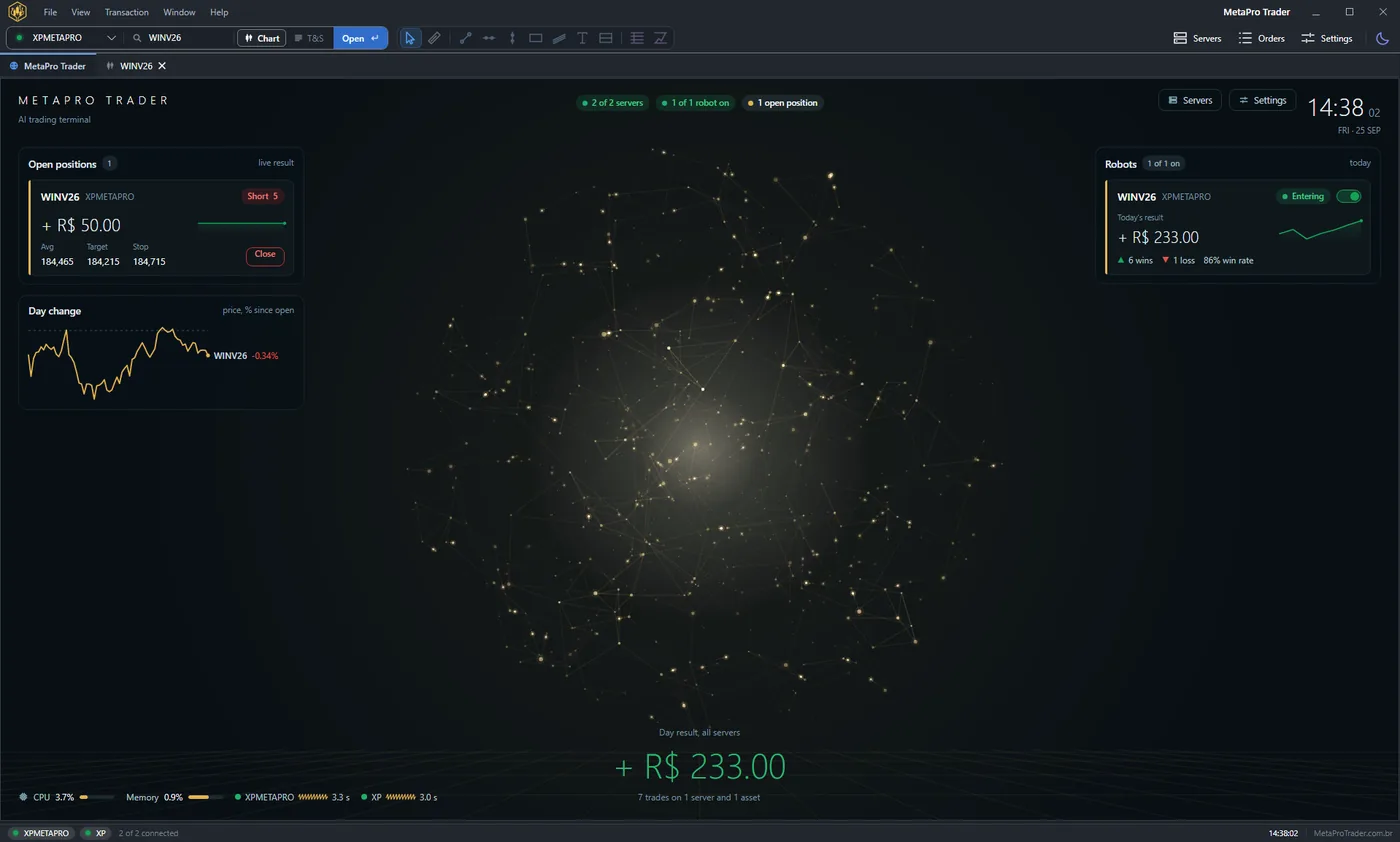
It is a scalping strategy for the Brazilian mini index (WIN) on the 1-minute chart. It runs inside MetaPro Trader, connected to your broker's MetaTrader 5 server. It trades with the trend and waits for price to pull back instead of chasing it. Each trade is handled as one package, with target, stop and trailing stop set before entry.
You don't write a single line of code. You pick the strategy in the lab, run the analysis on the asset's history and decide whether to apply it to the robot.
Three risk controls that come switched on
Order spacing follows the day. On a busy session the orders sit further apart; on a quiet one, closer. The same setup adapts to very different days.
Half size near stop clusters. When there is an area just past the trade's stop where stops tend to pile up, the robot enters with half the size. The decision is made before the order goes out.
Daily target. Once the day's result reaches the target you set, the robot stops opening new trades. In our tests, this was the rule that cut the number of losing days the most.
How the analysis is done
The lab follows five rules, and they apply to any strategy you test:
- What the analysis measures is what the robot executes: same entry, same order type, same exit rules.
- One order at a time, just like in the account.
- The cost per contract is deducted from every trade.
- When the target and the stop both fit inside the same candle, the analysis assumes the stop came first.
- Before applying, you see the worst case per trade and the suggested minimum capital.
What the Strategy tab panel shows
When the analysis finishes, the lab sums everything up in a single panel. In the MetaPro Scalp V2 analysis run on October 13, 2026 on the mini index, the test period had 346 trades with a 91.3% win rate, a profit factor of 1.47 and a result of R$ 6,241, with the default setting of 2 contracts.
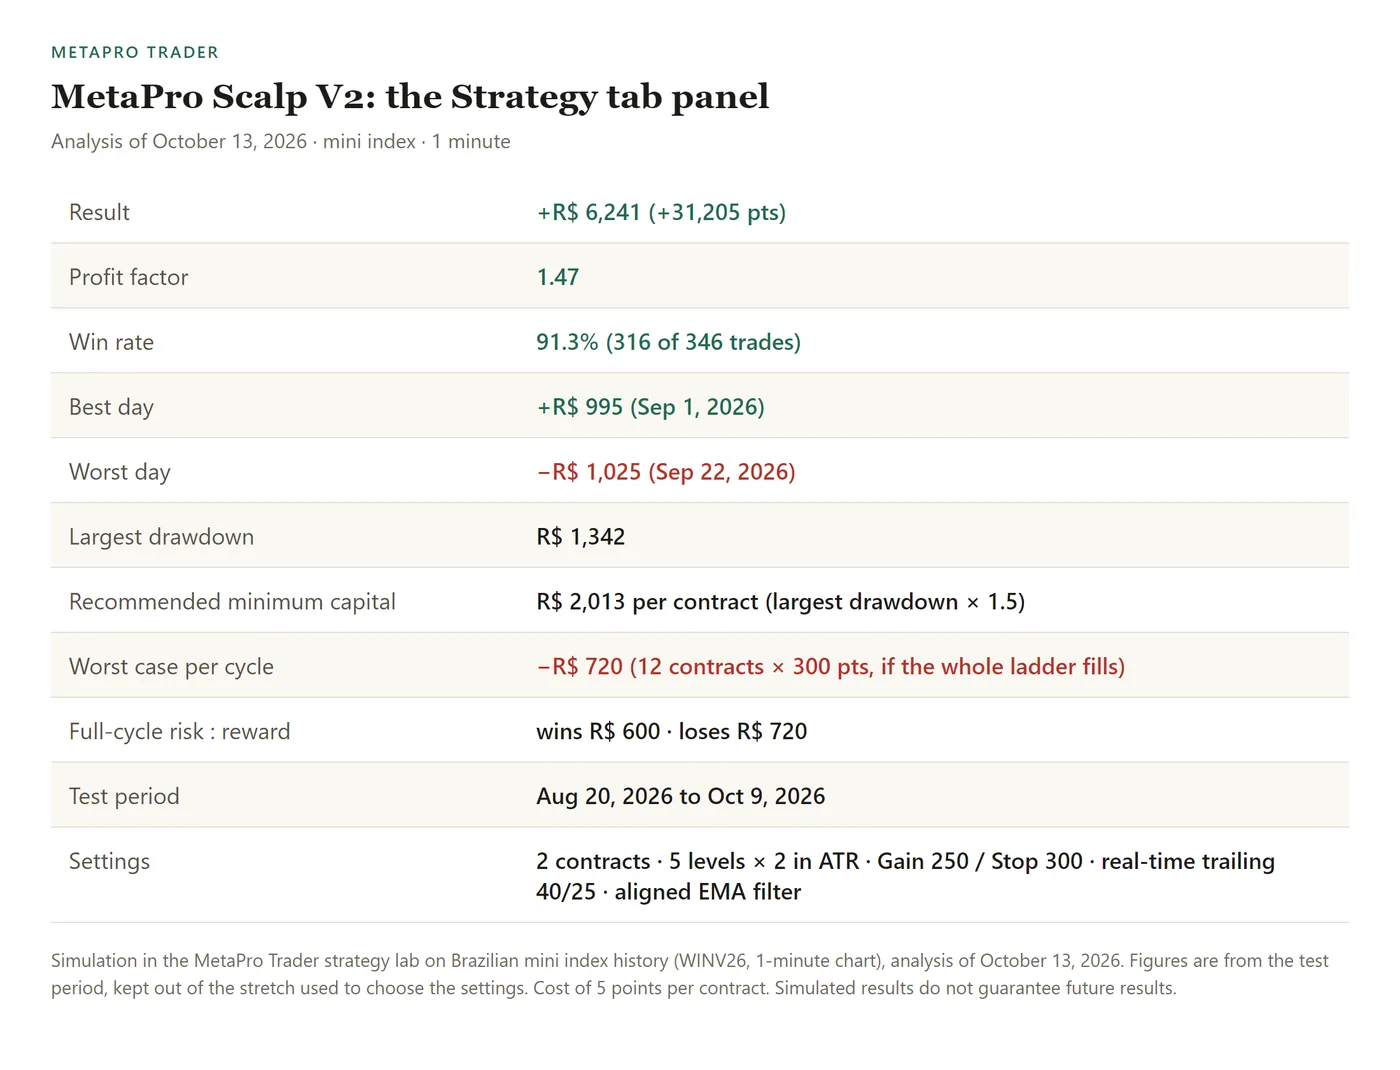
The same panel shows the best and the worst day, the largest drawdown, the suggested minimum capital and the worst case per cycle. You see the result and the risk side by side before switching the robot on.
Month by month, and the result curve
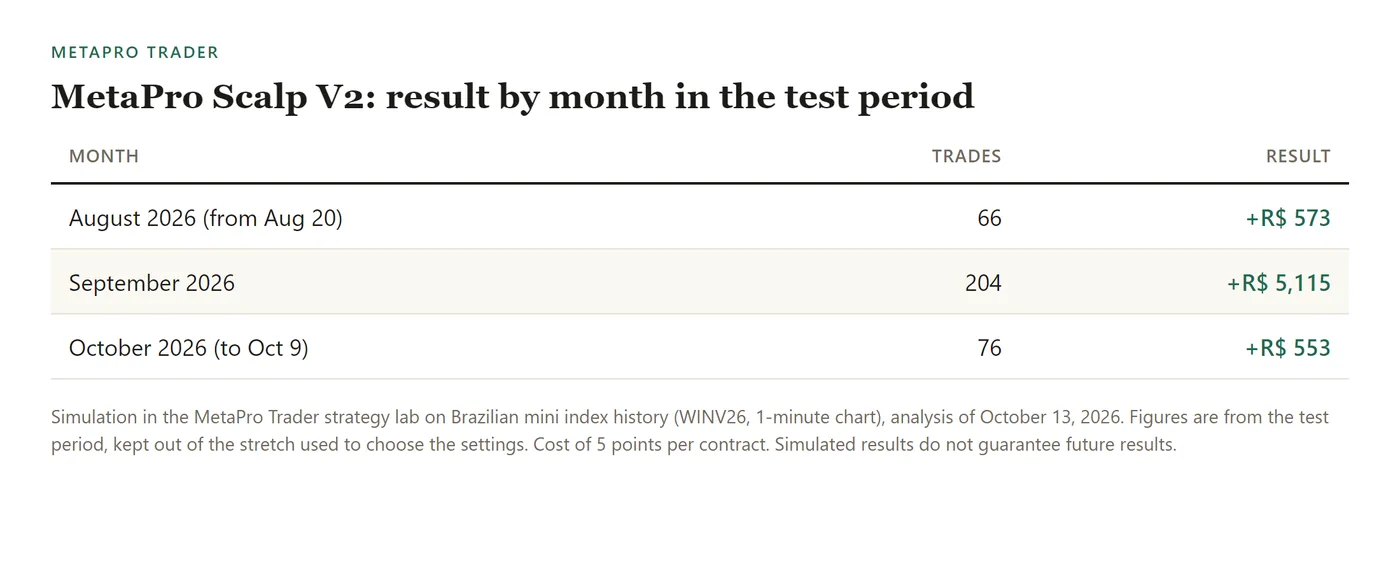
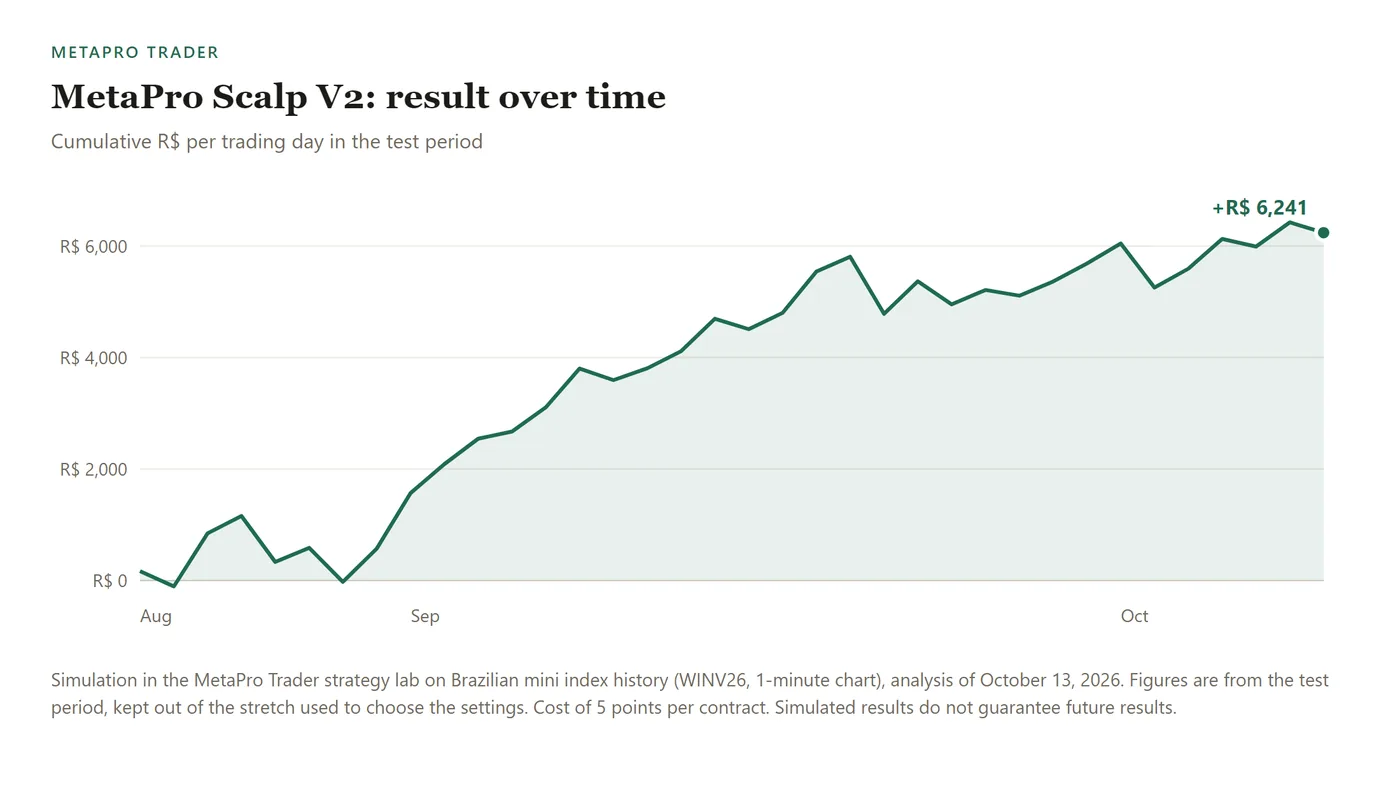
The result was positive in all three months of the test period, and the screen's own curve shows how it was built, day by day.
On the sessions recorded tick by tick, with real-time trailing
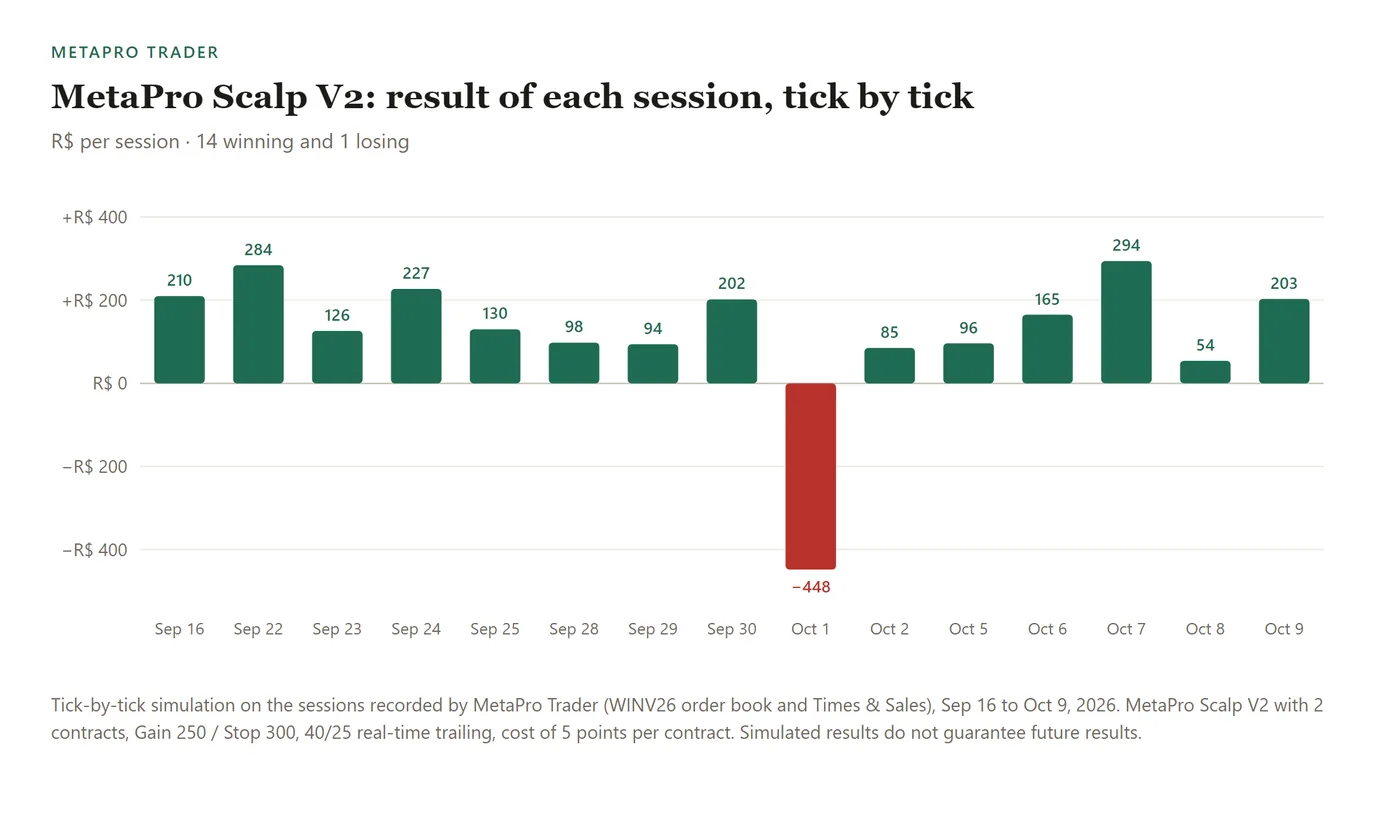
The lab measures the trailing stop at the close of each candle, because the history has no ticks. The robot, however, tightens the stop on every tick. To see V2 the way it really trades, we simulated tick by tick the 15 sessions MetaPro Trader recorded, from Sep 16 to Oct 9, 2026, with the 40/25 real-time trailing: 134 trades, a 97% win rate and 14 of 15 winning days.
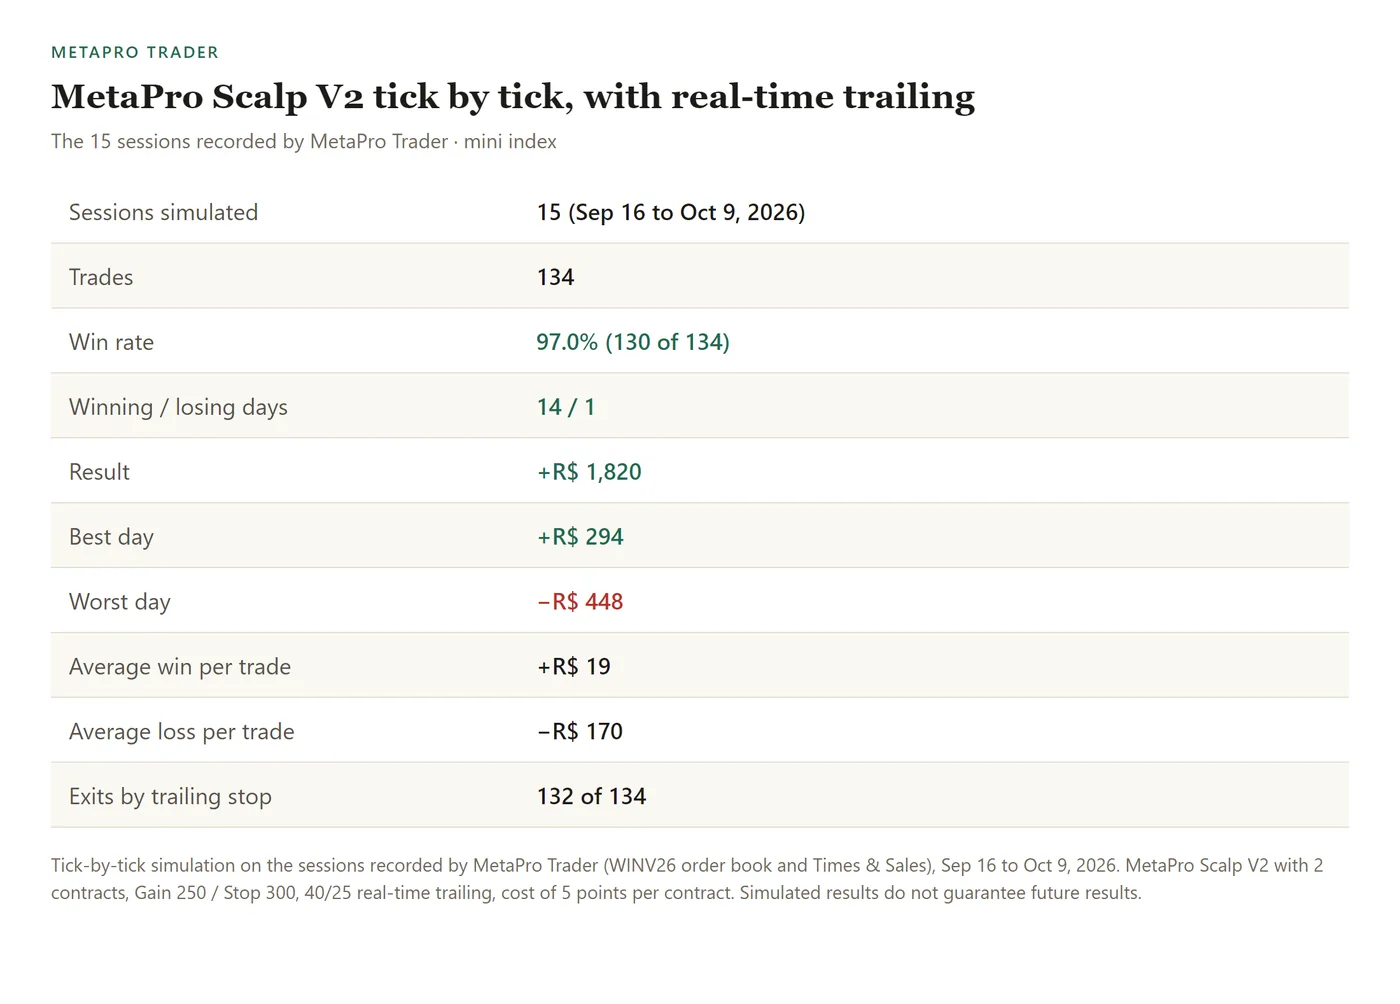
With real-time trailing, almost every trade exits through the trailing stop. When price moves 40 points in favor of the average price, the stop already locks 25 points of profit, before the grid ladder fills. Each win is small, and large losses become rare.
Step by step in MetaPro Trader: from login to the robot running
Everything happens in a single window connected to your MetaTrader 5 account. These are the steps, in the order you take them.
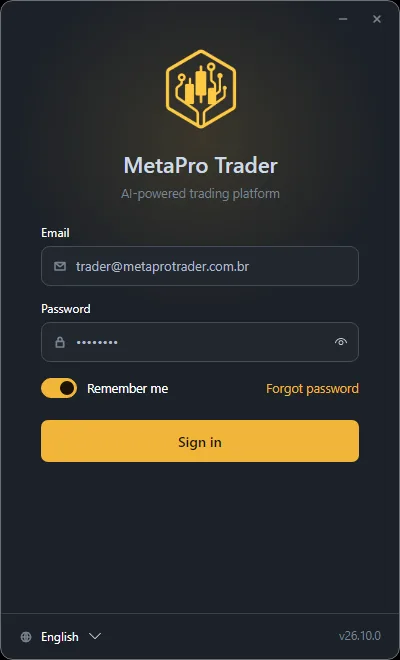
1. Sign in. The login screen remembers your access and the language you pick.
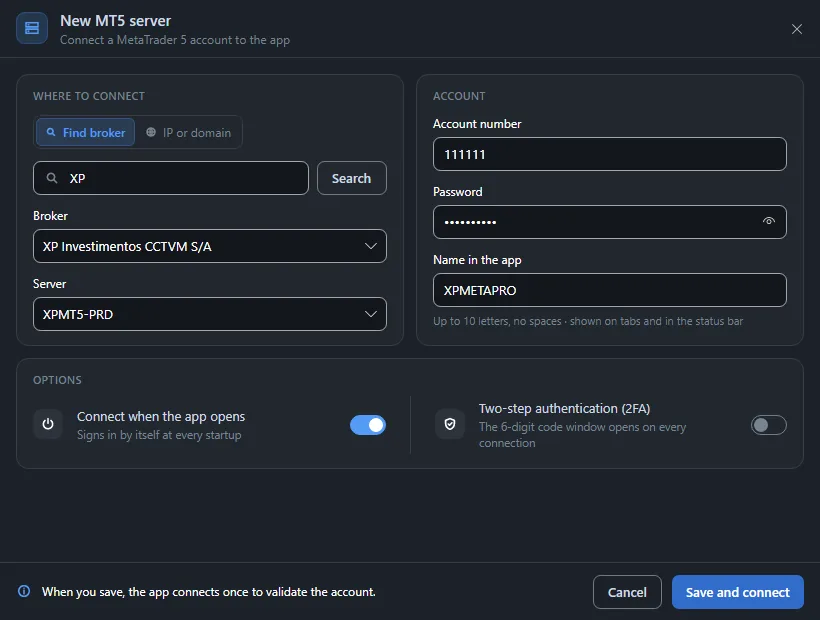
2. Connect your MT5 account. Under Servers, search for your broker, pick the server and enter your account number. The app connects straight to the broker’s MetaTrader 5 server, with no plugin.
3. Open the asset’s chart. In the top bar, pick the server, type the asset (for example, WINV26) and click Open.

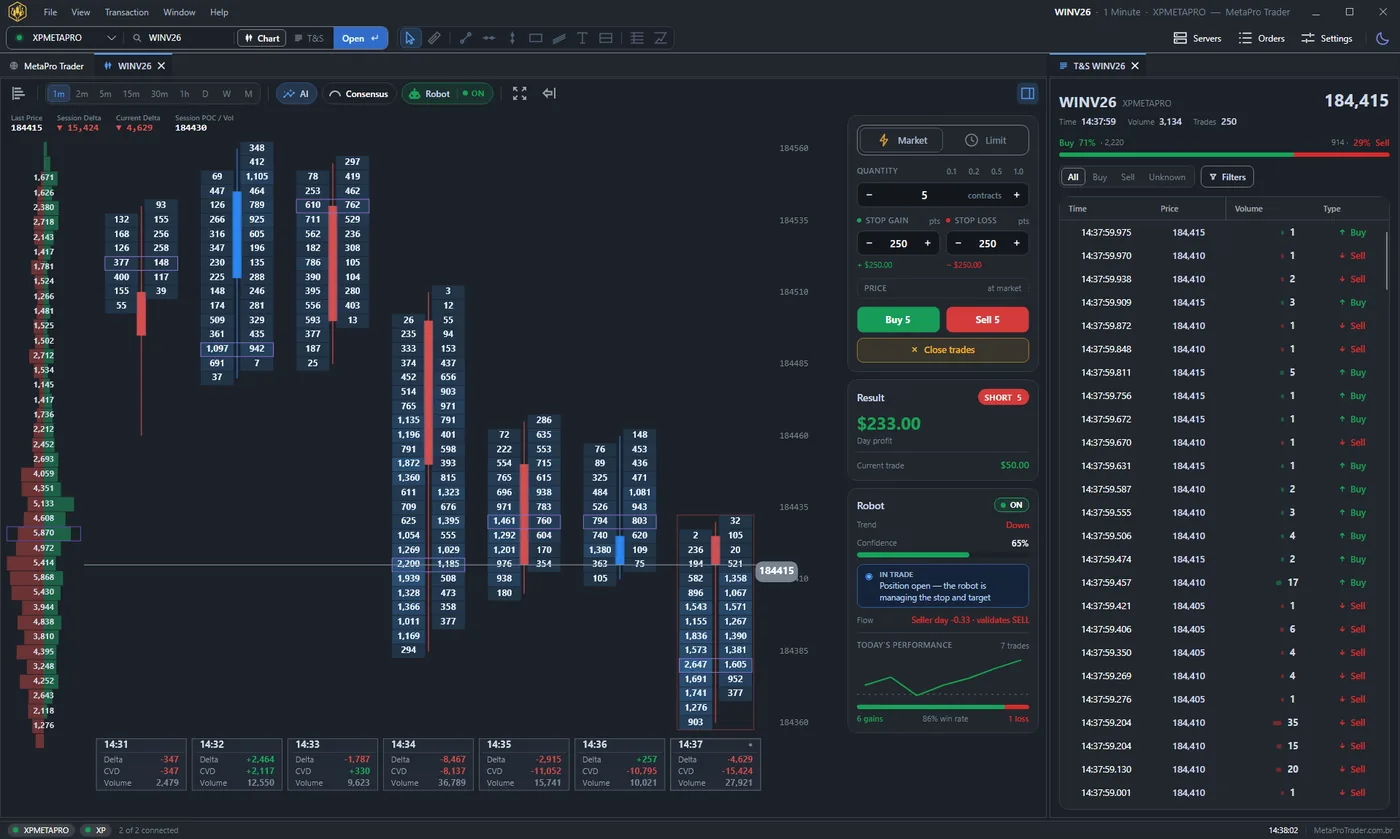
4. Get to know the workspace. In one place you have the Consensus AI panel, the chart with the AI’s marks, the order book, the buy and sell ticket, the robot panel and Times & Sales.
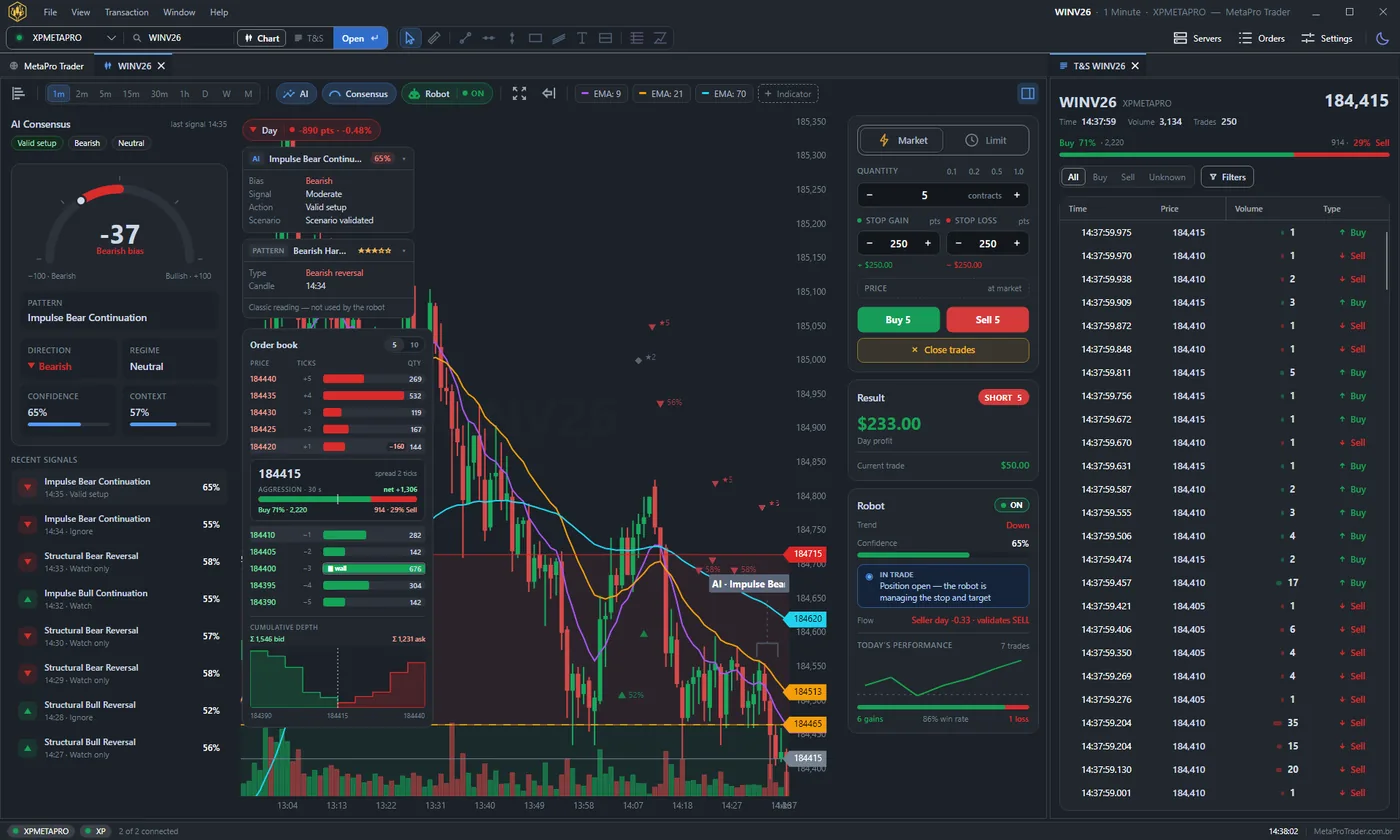
5. Click AI. The AI button sits on the chart bar (shortcut Ctrl+I). Once on, the AI reads every candle and marks the pattern it found on the chart.

6. The first time, run the training. Each timeframe has its own AI data. If the timeframe has none yet, the app shows “AI not trained for this timeframe” and offers to open the training screen. Click Train now.
7. Follow the training. The strategy lab opens on the AI data tab. Training downloads the asset’s history (for the mini index, the continuous WIN$D series), detects the patterns on every candle and stores how each one played out. It takes a few minutes and you can keep using the app; when it ends, the chart’s AI turns on by itself. The table shows each timeframe’s status: In use, Ready, Old, Preparing or Missing.
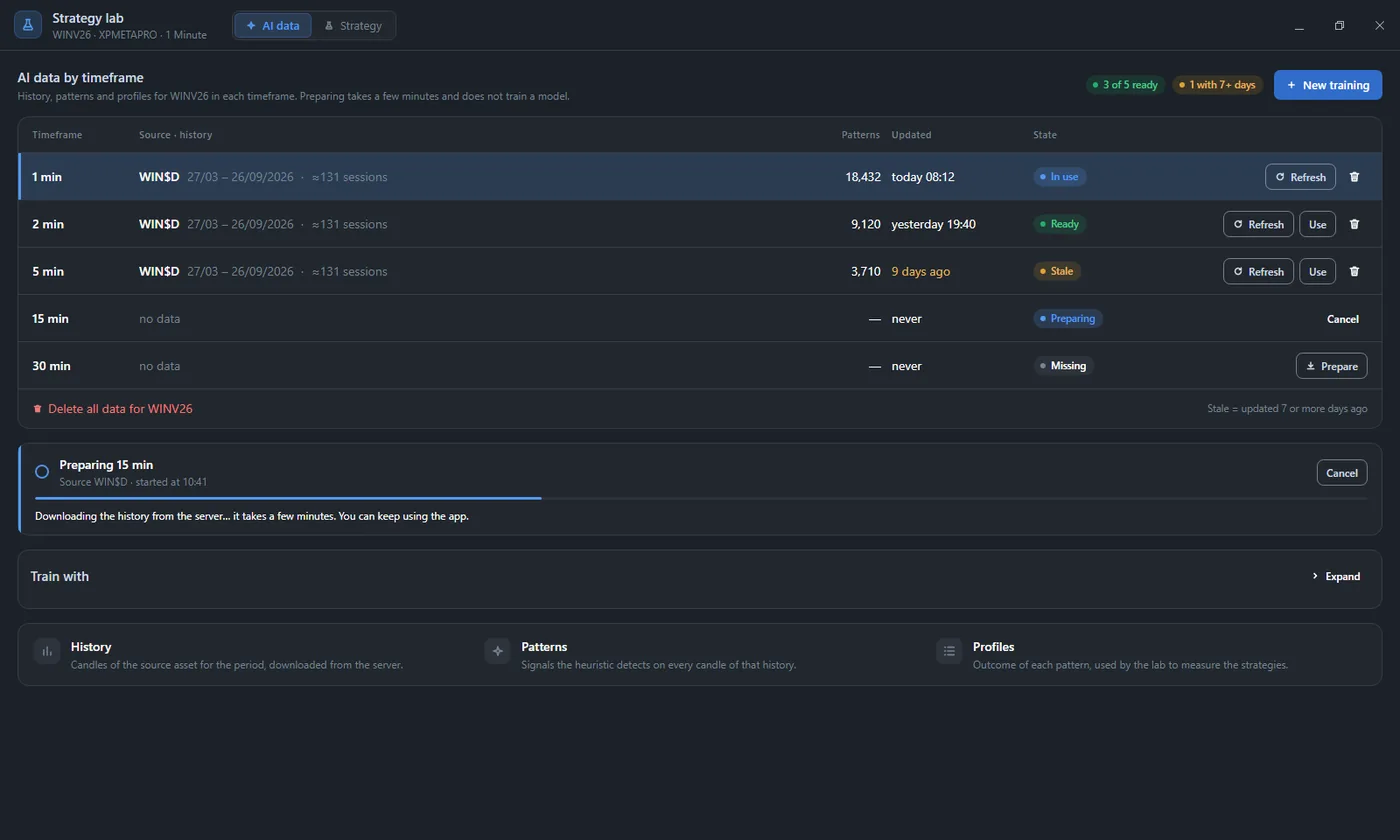
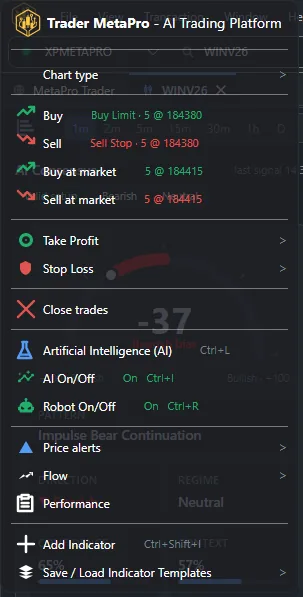
To get back to the lab later, right-click the chart and choose Artificial Intelligence (AI), or press Ctrl+L.
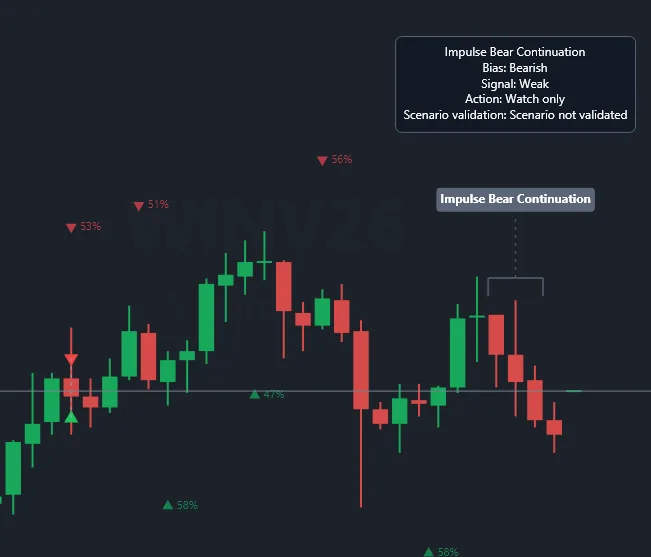
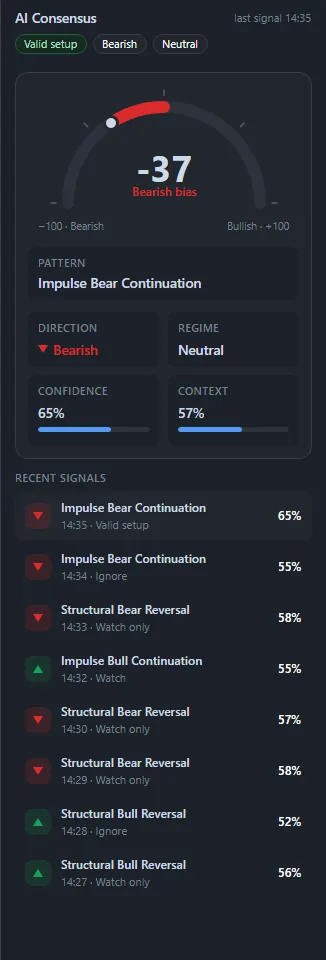
8. See the AI reading and the Consensus. With the AI on, its marks show up on the chart, and the Consensus button opens the panel with a −100 to +100 gauge, the pattern, the direction, the regime, the confidence, the context and the recent signals.

9. Set up the MetaPro Scalp V2 strategy. In the lab, open the Strategy tab and follow the Parameters column from top to bottom:
- Under Strategy, choose MetaPro Scalp V2.
- Click Measured default. The form gets the measured settings: Gain 250 and Stop 300 points, 2 initial contracts, Pullback entry, a 5-level ladder spaced by volatility (ATR), aligned EMA filter and a 40/25 real-time trailing stop.
- Check the Worst case per cycle at the top of the column (−R$ 720 with the whole ladder filled) and the risk : reward bar.
- Under Risk management, review the daily gain (R$ 600 by default) and, if you like, the daily loss.
- Click Start analysis. The Running the analysis card shows the progress.
10. Read the result and click Use. When the analysis ends, the panel shows result, win rate, profit factor, best and worst day, minimum capital and the curve, like the one shown above. Each analysis becomes a row in the Analyses table; on the one you pick, click Use. The row then shows In use, and the robot adopts those settings.
11. Turn on the robot. The Robot button, next to AI and Consensus, turns on automatic execution on the chart.

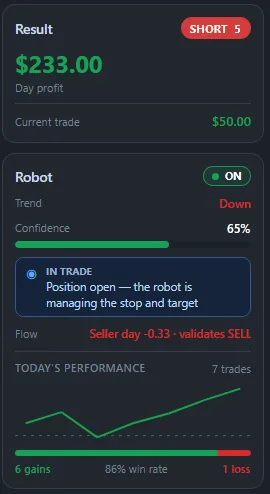
From then on the panel shows the trend reading, the confidence, the trade in progress and the day's performance. You can pause whenever you want. Orders stay at your broker; MetaPro Trader does not hold or move your money.
Bonus: order flow. On the same chart you can open Order Flow, which shows the volume traded at each price, plus the delta and the CVD of every candle.
Who it is for
For traders who already trade the mini index and want to hand off execution without losing track of what the robot will do. And for anyone tired of pretty backtests: here you see how the analysis was done, with costs, worst case and minimum capital on the same screen, before you switch anything on.
This article was written by the MetaPro Trader team. Trading in financial markets involves risk of loss. Simulated and past results do not guarantee future results, and nothing here is investment advice.
Learn more
- Manual: the robot strategy lab
- Manual: connect your MT5 account
- Manual: AI on the chart
- Day trading indicators for MT5
- MetaPro Trader: AI day trading platform for MT5
Keep reading
- The Market Breadth Radar MetaTrader 5 Doesn’t Have: Stocks, Dollar and Foreign Indices From Different Brokers on One Chart
- Automatic Fibonacci Indicator for MT5: Day Trading Levels and Targets That Draw Themselves
- Machine Learning Trading Indicator for MT5: AI That Keeps Its Own Score on Screen
- Automatic Stop Loss and Take Profit Indicator for MT5: Trade With the Plan on the Chart
- Buy and Sell Signal Indicator for MT5: See the Turn on the Exact Candle
- Divergence Indicator for MT5: See When a Move Is Running Out of Strength
- Range Breakout Indicator for MT5: Catch the Breakout the Moment It Happens
- Volume Profile Indicator for MT5 Day Trading: Follow the Money, Not Just the Price
- Order Block Indicator With Volume for MT5: Find Where the Big Moves Came From
- Intraday Support and Resistance Indicator for MT5: Start the Session With the Levels Drawn
- Smart Money Concepts Indicator for MT5: Market Structure the Way Professionals Read It
- Automatic Chart Pattern Indicator for MT5: Head and Shoulders, Triangles and Flags Found for You
- Automatic Support and Resistance Indicator for MT5, Scored From 0 to 100
- Buying and Selling Pressure Indicator for MT5: Who Is Running the Market Right Now
- Volume-Based Support and Resistance Indicator for MT5: Levels Confirmed by Real Trading
- Multi-Timeframe Candle Indicator for MT5: The Daily Candle on Your 1-Minute Chart