Indicators
Intraday Support and Resistance Indicator for MT5: Start the Session With the Levels Drawn
Support & Resistance Map draws the day’s zones, the liquidity levels, the VWAP and the opening range for mini index day trading.
The first hour is the worst time to draw lines
The worst time to draw support and resistance is the first hour of the session, and that is exactly when you need it most. While you are still marking yesterday’s levels, the market is deciding today’s range.
Support & Resistance Map prepares the session for you. It draws the day’s supply and demand zones, the prices where volume was unusual, the average price of the day (VWAP) and the opening range, and it marks two events traders love: a level that was reclaimed and a break that turned out to be a trap.
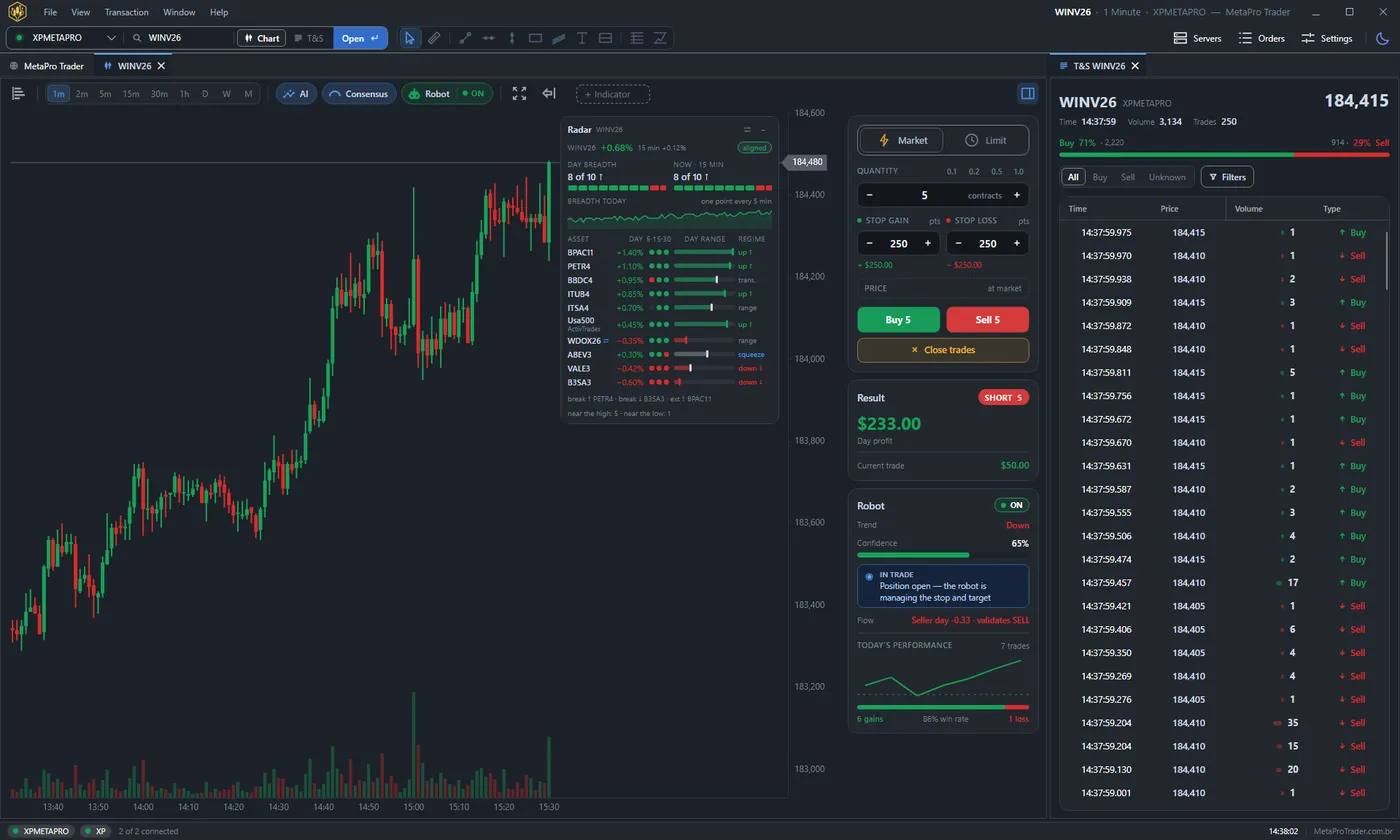
MetaPro Trader, the platform where this map lives, also answers a question no support line can: is the rest of the market moving with your asset right now? Its Radar card sits on the chart and reads a list of related assets, the ten largest stocks of the Ibovespa when you trade the mini index, showing how many of them agree with the move, their momentum and where each one sits in its own range.
Scene 1: a rally day, mapped level by level
August 25, 12:30. The mini index climbed most of the morning and was trading near 175,395.
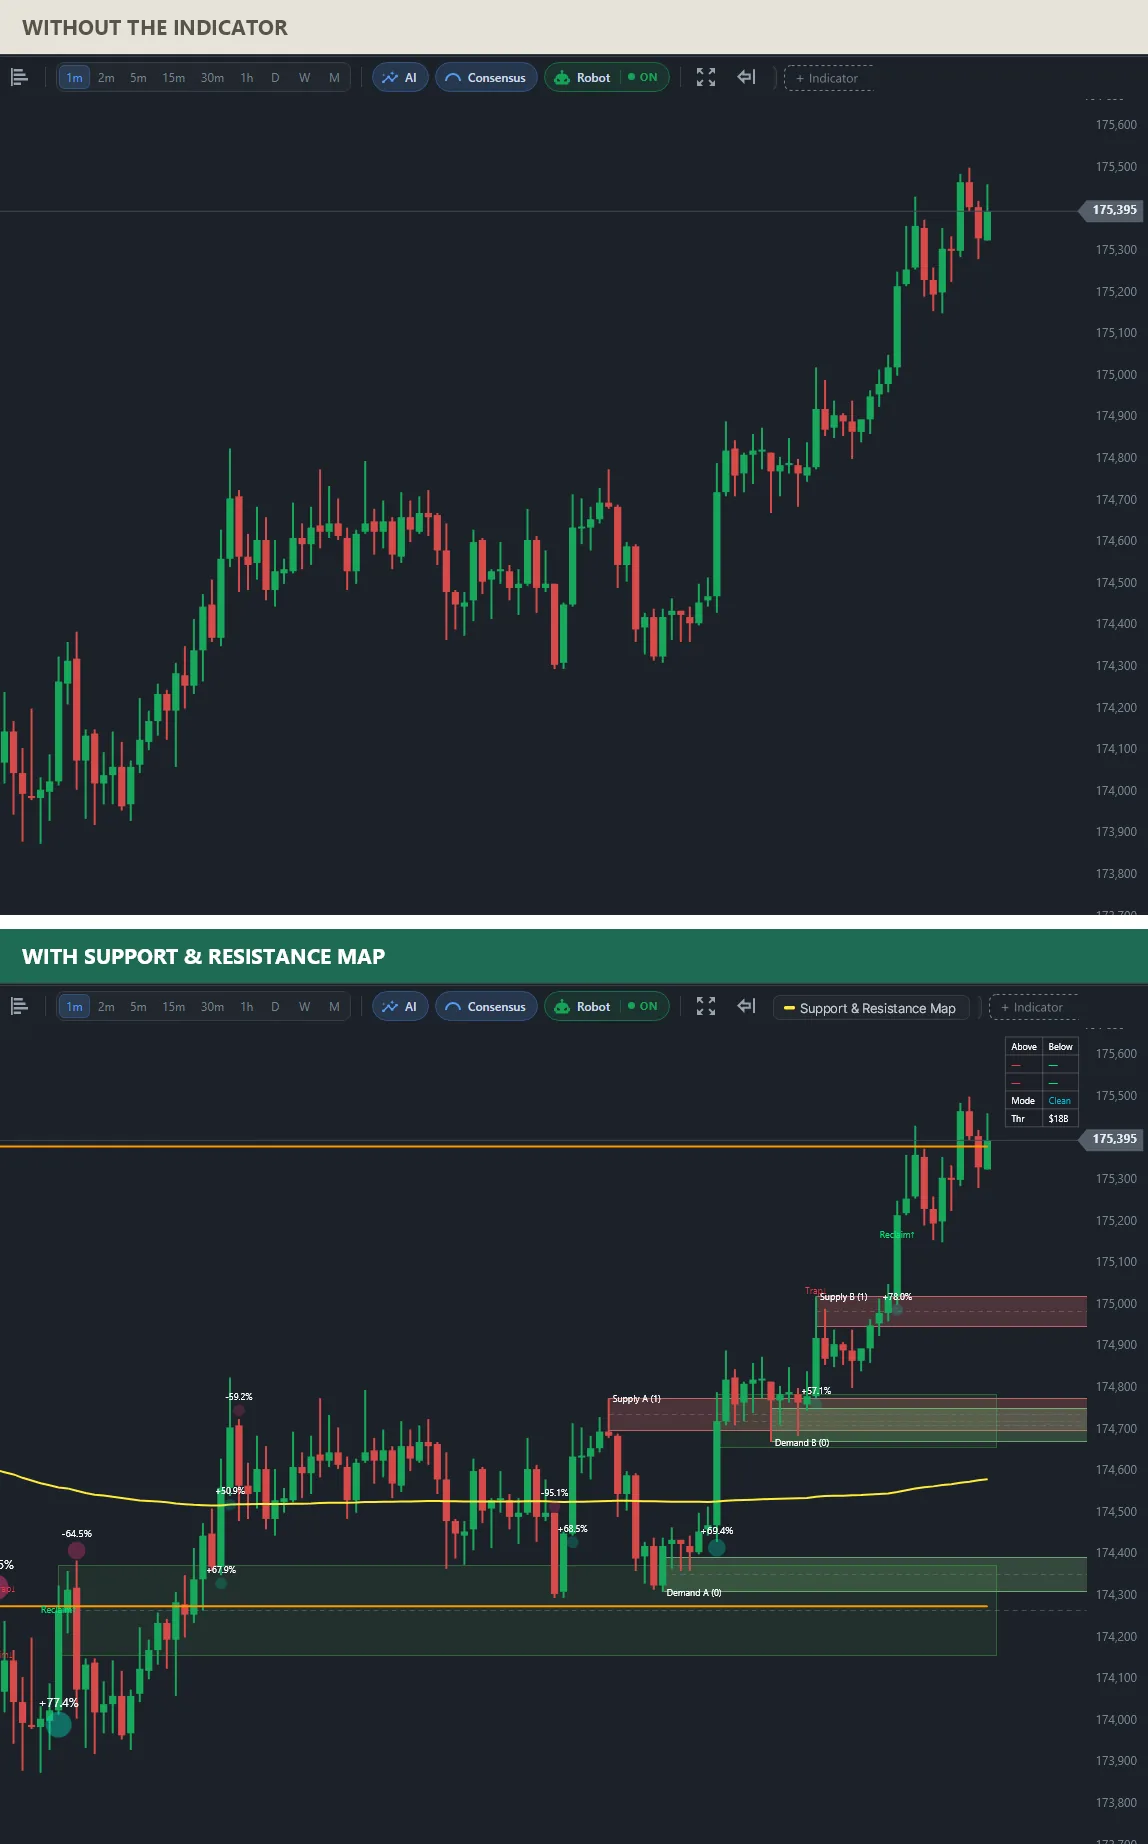
The plain chart shows a climb. The map shows its steps: demand zones where the climb paused, supply zones that were broken, the rising VWAP underneath and the opening range lines as the first reference of the day. Bubbles mark the candles with unusual volume and their delta. Near 175,000 a Trap label marks a break that failed, and the Reclaim just above it marks price taking the level back.
Scene 2: price pinned at the opening range
September 14, 13:00. After a strong morning, the mini index was sitting right on a reference line near 187,365.
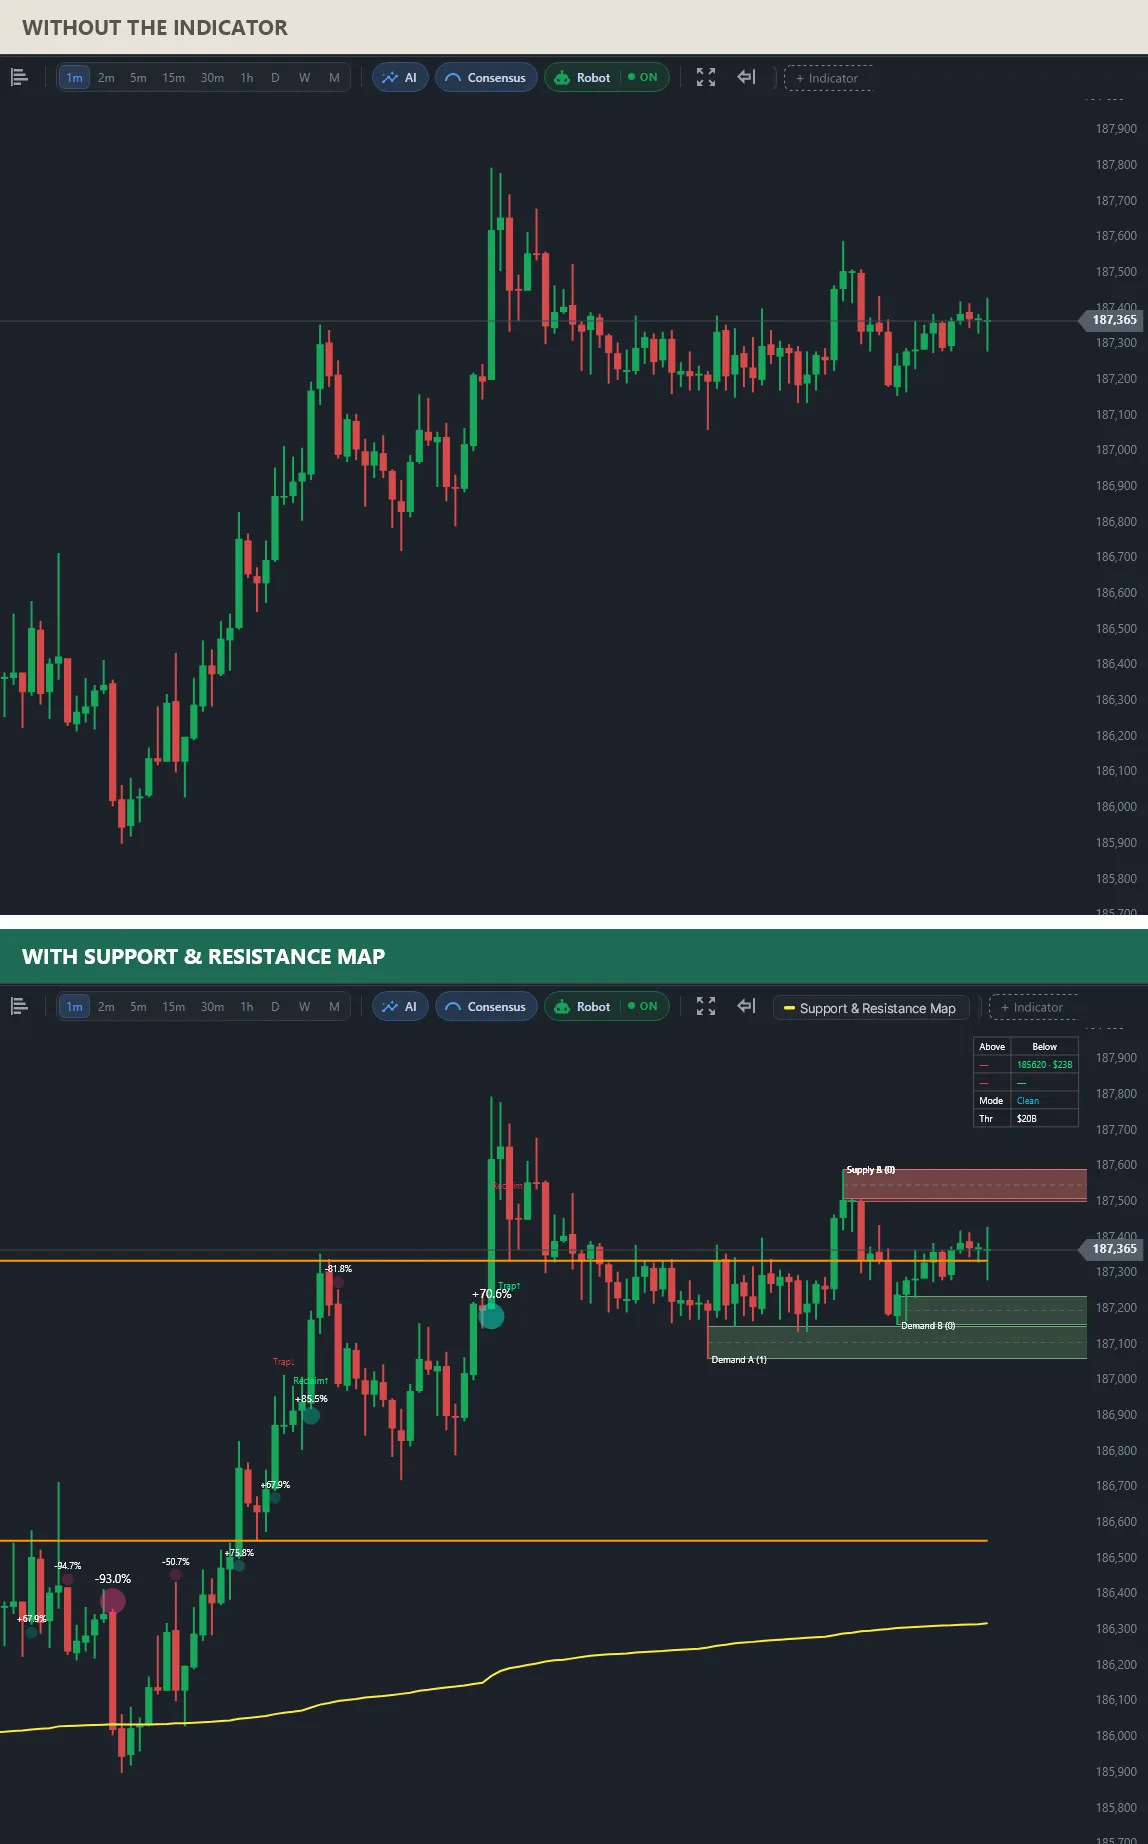
With the map on, the sideways afternoon has a reason: price is sitting on the opening range line, with a supply zone just above around 187,500–187,600 and two demand zones just below around 187,100–187,200. The VWAP is far below, near 186,300, a reminder of how stretched the morning rally was. The large bubbles on the left mark the candles where volume stood out.
Levels, traps and reclaims in a normal mini index session
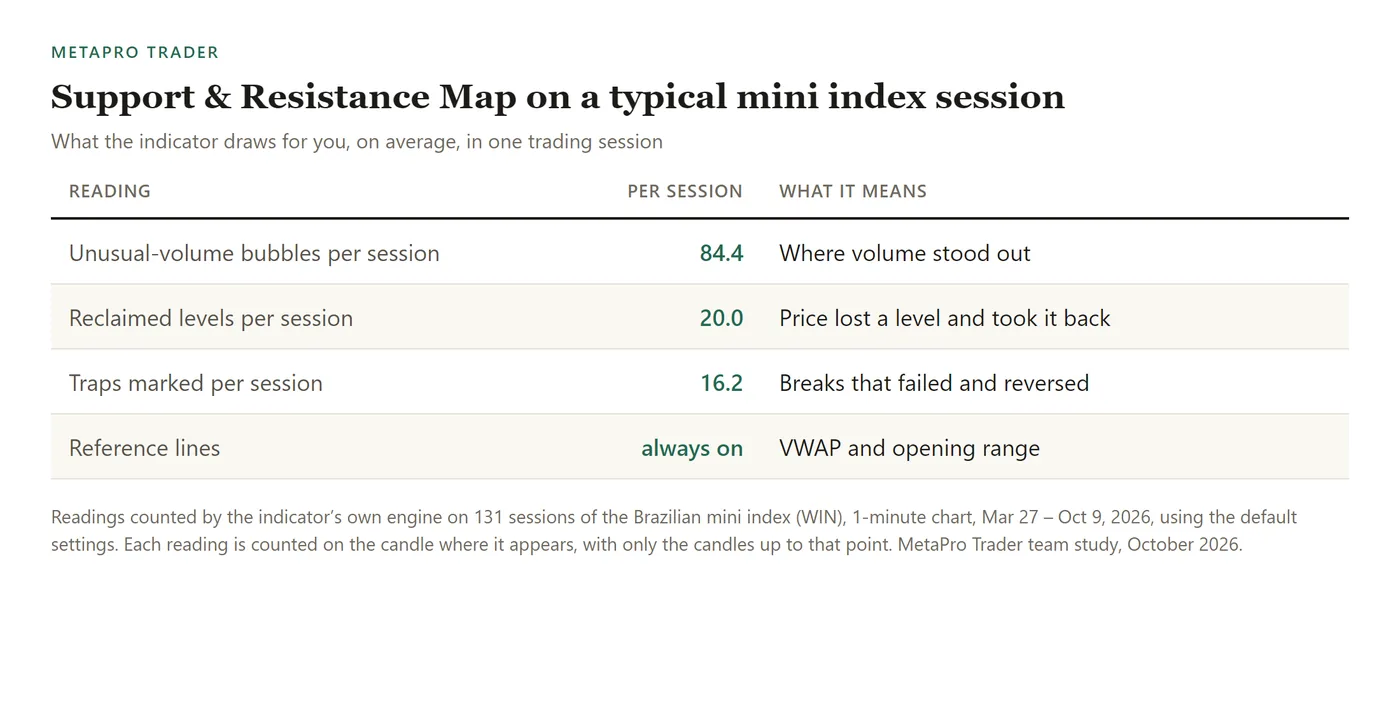
Across 131 sessions of the Brazilian mini index (WIN), 1-minute chart, Mar 27 – Oct 9, 2026, the map drew 84.4 unusual-volume bubbles, 20 reclaimed levels and 16.2 traps per session on average, with the VWAP and the opening range always on.
How to add the intraday support and resistance indicator to MT5
In MetaPro Trader, connect MetaTrader 5, open the chart, click + Indicator and select Support & Resistance Map in the Signals tab. Start the day with the opening range as your first reference; the zones fill in as the session develops, and a trap at a zone is often a better read than the zone alone.
This article was written by the MetaPro Trader team. The charts are real mini index sessions drawn by the indicator’s own engine. Trading in financial markets involves risk of loss; the indicator helps you read the chart and does not send orders, and nothing here is investment advice.
Learn more
- Intraday support and resistance indicator for MT5
- Support and resistance zones scored 0 to 100
- The daily candle on your intraday chart
- More indicators for MT5 day trading
- The MetaPro Trader platform
Keep reading
- A day trading bot for the mini index: how we test MetaPro Scalp V2 before it goes live
- The Market Breadth Radar MetaTrader 5 Doesn’t Have: Stocks, Dollar and Foreign Indices From Different Brokers on One Chart
- Automatic Fibonacci Indicator for MT5: Day Trading Levels and Targets That Draw Themselves
- Machine Learning Trading Indicator for MT5: AI That Keeps Its Own Score on Screen
- Automatic Stop Loss and Take Profit Indicator for MT5: Trade With the Plan on the Chart
- Buy and Sell Signal Indicator for MT5: See the Turn on the Exact Candle
- Divergence Indicator for MT5: See When a Move Is Running Out of Strength
- Range Breakout Indicator for MT5: Catch the Breakout the Moment It Happens
- Volume Profile Indicator for MT5 Day Trading: Follow the Money, Not Just the Price
- Order Block Indicator With Volume for MT5: Find Where the Big Moves Came From
- Smart Money Concepts Indicator for MT5: Market Structure the Way Professionals Read It
- Automatic Chart Pattern Indicator for MT5: Head and Shoulders, Triangles and Flags Found for You
- Automatic Support and Resistance Indicator for MT5, Scored From 0 to 100
- Buying and Selling Pressure Indicator for MT5: Who Is Running the Market Right Now
- Volume-Based Support and Resistance Indicator for MT5: Levels Confirmed by Real Trading
- Multi-Timeframe Candle Indicator for MT5: The Daily Candle on Your 1-Minute Chart