Indicators
Buying and Selling Pressure Indicator for MT5: Who Is Running the Market Right Now
Pressure Map Pro shows in percent which side has more strength, where buyers and sellers are concentrated and the most contested level.
Who is still waiting on each side of the price
Every price on the chart is a negotiation between buyers and sellers. Candles show who won the last minute. They do not show where each side is still waiting, with how much volume, and which of them is closer to the current price.
Pressure Map Pro maps that. It measures the volume sitting on each side of price, shows the balance in percent, highlights the levels where each side is concentrated and draws a line to the level it considers the target. It also keeps a small table of how its reading did before, with chance next to it for comparison.
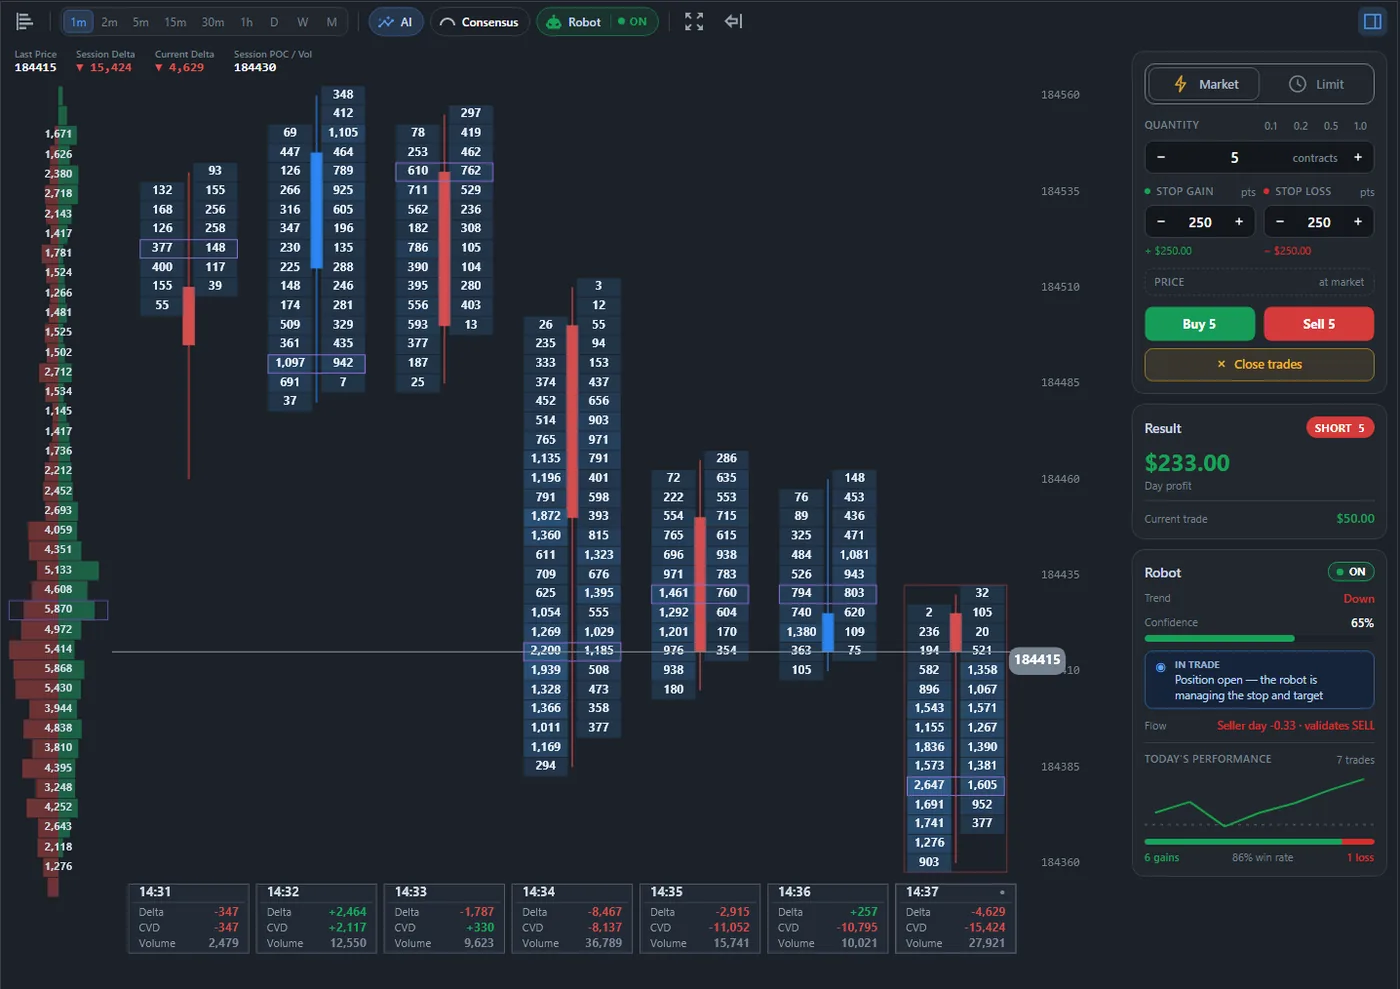
Pressure Map Pro runs inside MetaPro Trader, a day trading platform for MT5 that also has a full order flow chart. There every candle opens into the volume traded at each price, with the delta and the totals of each candle underneath, while the order ticket and the robot panel stay on the side. Pressure on the price chart, volume inside the candle: two views of the same fight.
Scene 1: 71% of the weight below the price
September 16, 14:00. The mini index had dropped from about 188,300 to 187,755.
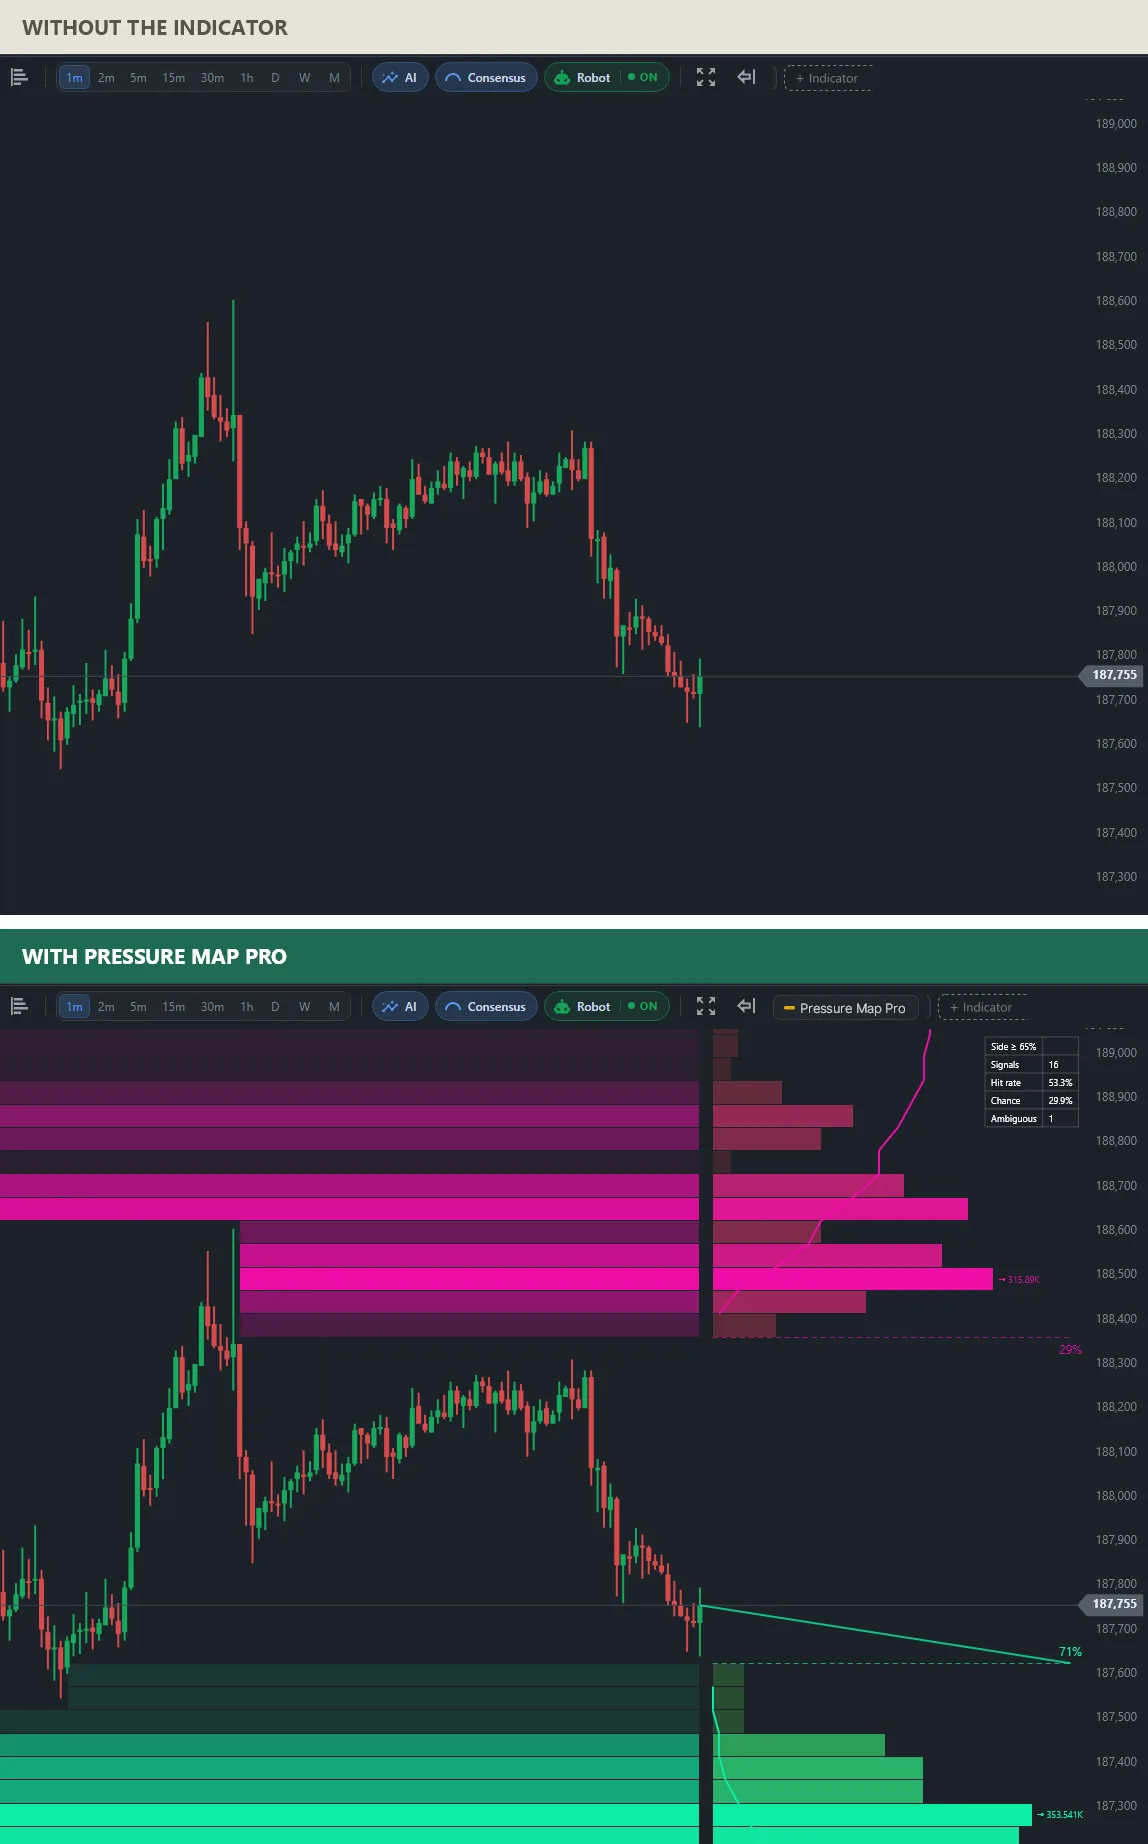
On the plain chart, the fall could go anywhere. The map puts numbers on it: 29% of the volume sits above price, on the selling side, and 71% below it, on the buying side. The brightest rows show where each side is concentrated, with 315.89K near 188,500 above and 353.541K near 187,300 below, and the green line points to the buying side, the one the map treats as the target.
Scene 2: the balance flips to the selling side
July 24, 12:30. The mini index was going sideways around 179,525.
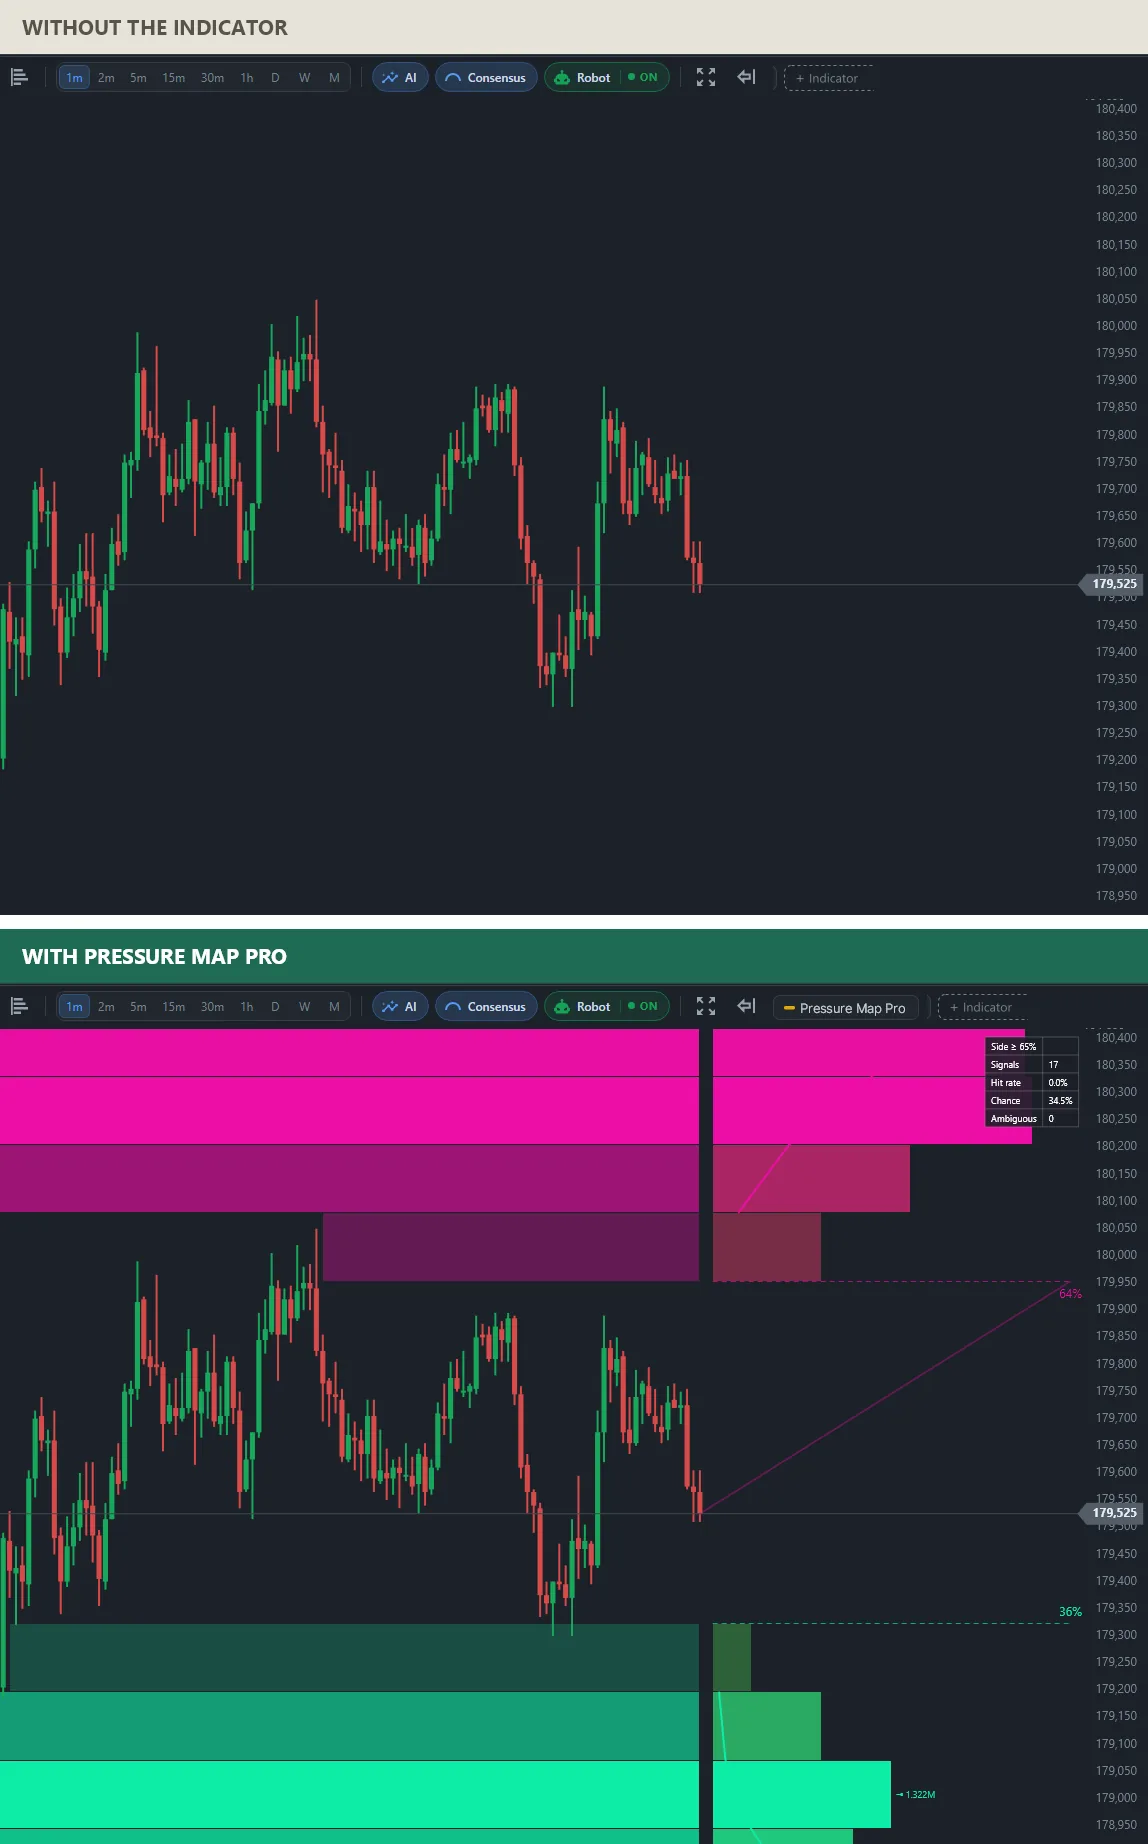
The same tool, the opposite reading: 64% of the volume is above price and 36% below, so the line now points up, towards the selling side near 179,950. Below, the heaviest single level sits around 179,000 with 1.322M. The table in the corner shows how the reading did in the past on this chart, always next to what chance would give, so you judge the map on your own asset instead of taking it on faith.
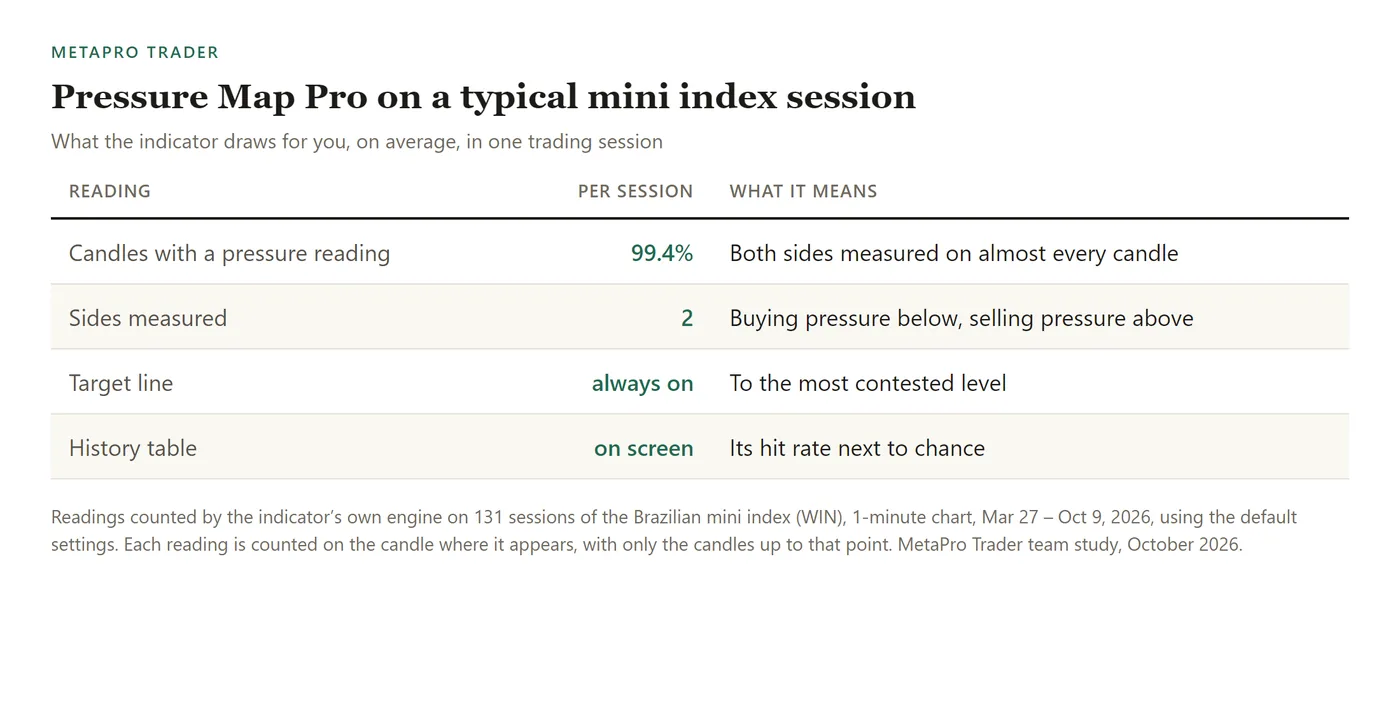
Buying and selling pressure readings on a typical mini index session
Across 131 sessions of the Brazilian mini index (WIN), 1-minute chart, Mar 27 – Oct 9, 2026, Pressure Map Pro produced a reading of both sides on 99.4% of the candles, with the target line always on and the history table on screen.
How to add the buying and selling pressure indicator to MT5
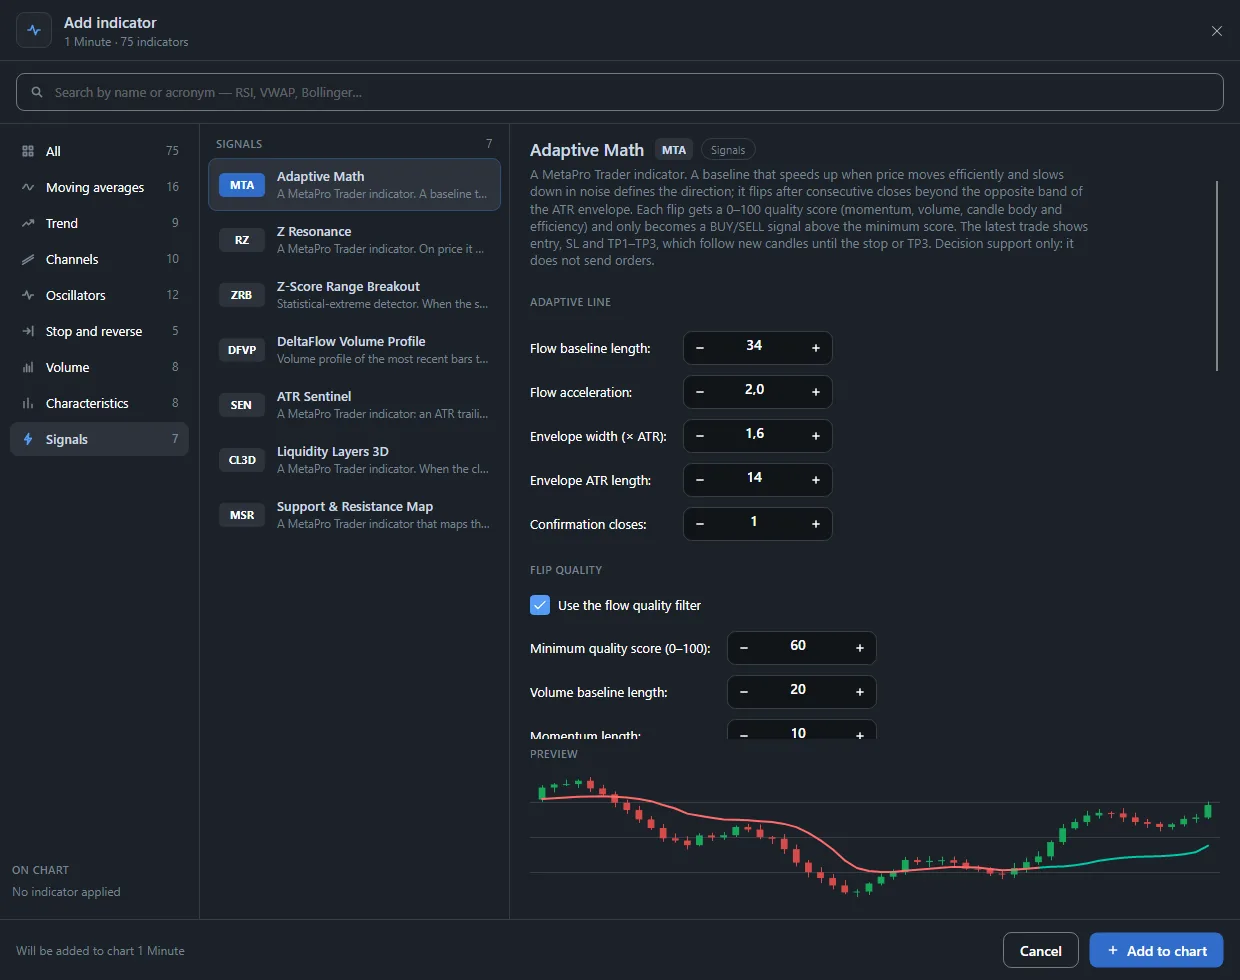
In MetaPro Trader, with your MT5 account connected, open the chart, click + Indicator and choose Pressure Map Pro in the Signals tab. Read the percentage together with the distance to each level: a strong side far away matters less than a close one. Keep the history table open to see how the reading behaves on your asset.
Written by the MetaPro Trader team. Every chart above is a real 1-minute mini index session, drawn by the same engine that runs in the platform. The indicator does not place orders and is not a recommendation; trading carries risk of loss.
Learn more
- Buying and selling pressure indicator for MT5
- Volume profile for MT5 day trading
- Order blocks with volume for MT5
- More indicators for MT5 day trading
- The MetaPro Trader platform
Keep reading
- A day trading bot for the mini index: how we test MetaPro Scalp V2 before it goes live
- The Market Breadth Radar MetaTrader 5 Doesn’t Have: Stocks, Dollar and Foreign Indices From Different Brokers on One Chart
- Automatic Fibonacci Indicator for MT5: Day Trading Levels and Targets That Draw Themselves
- Machine Learning Trading Indicator for MT5: AI That Keeps Its Own Score on Screen
- Automatic Stop Loss and Take Profit Indicator for MT5: Trade With the Plan on the Chart
- Buy and Sell Signal Indicator for MT5: See the Turn on the Exact Candle
- Divergence Indicator for MT5: See When a Move Is Running Out of Strength
- Range Breakout Indicator for MT5: Catch the Breakout the Moment It Happens
- Volume Profile Indicator for MT5 Day Trading: Follow the Money, Not Just the Price
- Order Block Indicator With Volume for MT5: Find Where the Big Moves Came From
- Intraday Support and Resistance Indicator for MT5: Start the Session With the Levels Drawn
- Smart Money Concepts Indicator for MT5: Market Structure the Way Professionals Read It
- Automatic Chart Pattern Indicator for MT5: Head and Shoulders, Triangles and Flags Found for You
- Automatic Support and Resistance Indicator for MT5, Scored From 0 to 100
- Volume-Based Support and Resistance Indicator for MT5: Levels Confirmed by Real Trading
- Multi-Timeframe Candle Indicator for MT5: The Daily Candle on Your 1-Minute Chart