Indicators
Range Breakout Indicator for MT5: Catch the Breakout the Moment It Happens
Z-Score Range Breakout shows stretched prices, draws the range where price settled and marks the breakout candle automatically.
Which range matters, and where it ends
Breakout traders live on a thin line. Enter too early and the range swallows you; enter too late and you buy the top of the breakout candle. The hard part is not the breakout itself, it is knowing which range matters and where exactly it ends.
Z-Score Range Breakout draws that range for you. It measures how far price has stretched from its normal behavior, and after a stretch it boxes the area where price settles, projects the box’s top, middle and bottom forward and marks the candle where price leaves it.
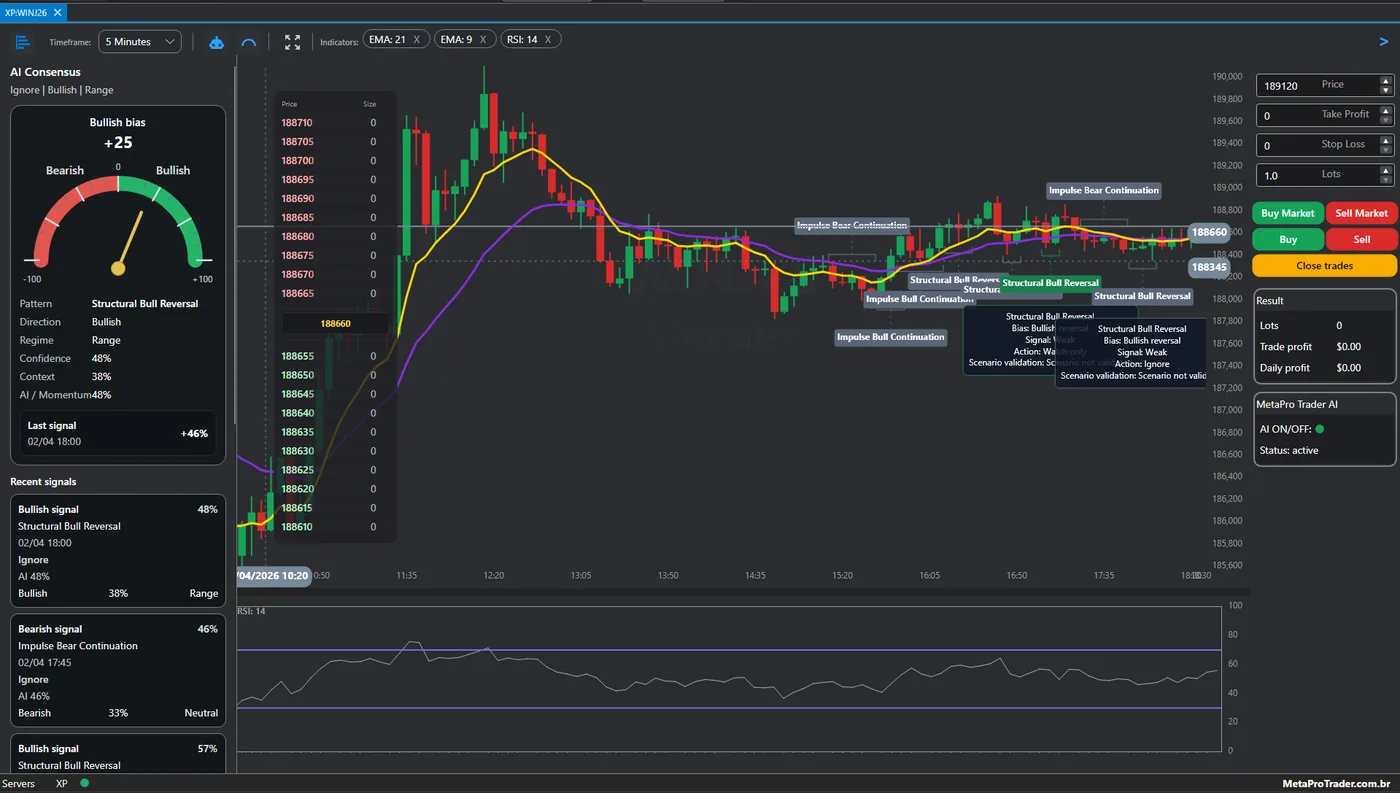
Every scene here was captured in MetaPro Trader, a day trading platform that connects directly to your MetaTrader 5 broker account. The chart, the Consensus AI panel on the left, the AI’s pattern labels on the candles and the order ticket on the right share the same window, so a breakout you spot can be traded without switching programs or copying prices by hand.
Scene 1: a stretch up, a range and a break down
August 19, noon. The mini index rallied more than 1,500 points and then spent an hour going nowhere.
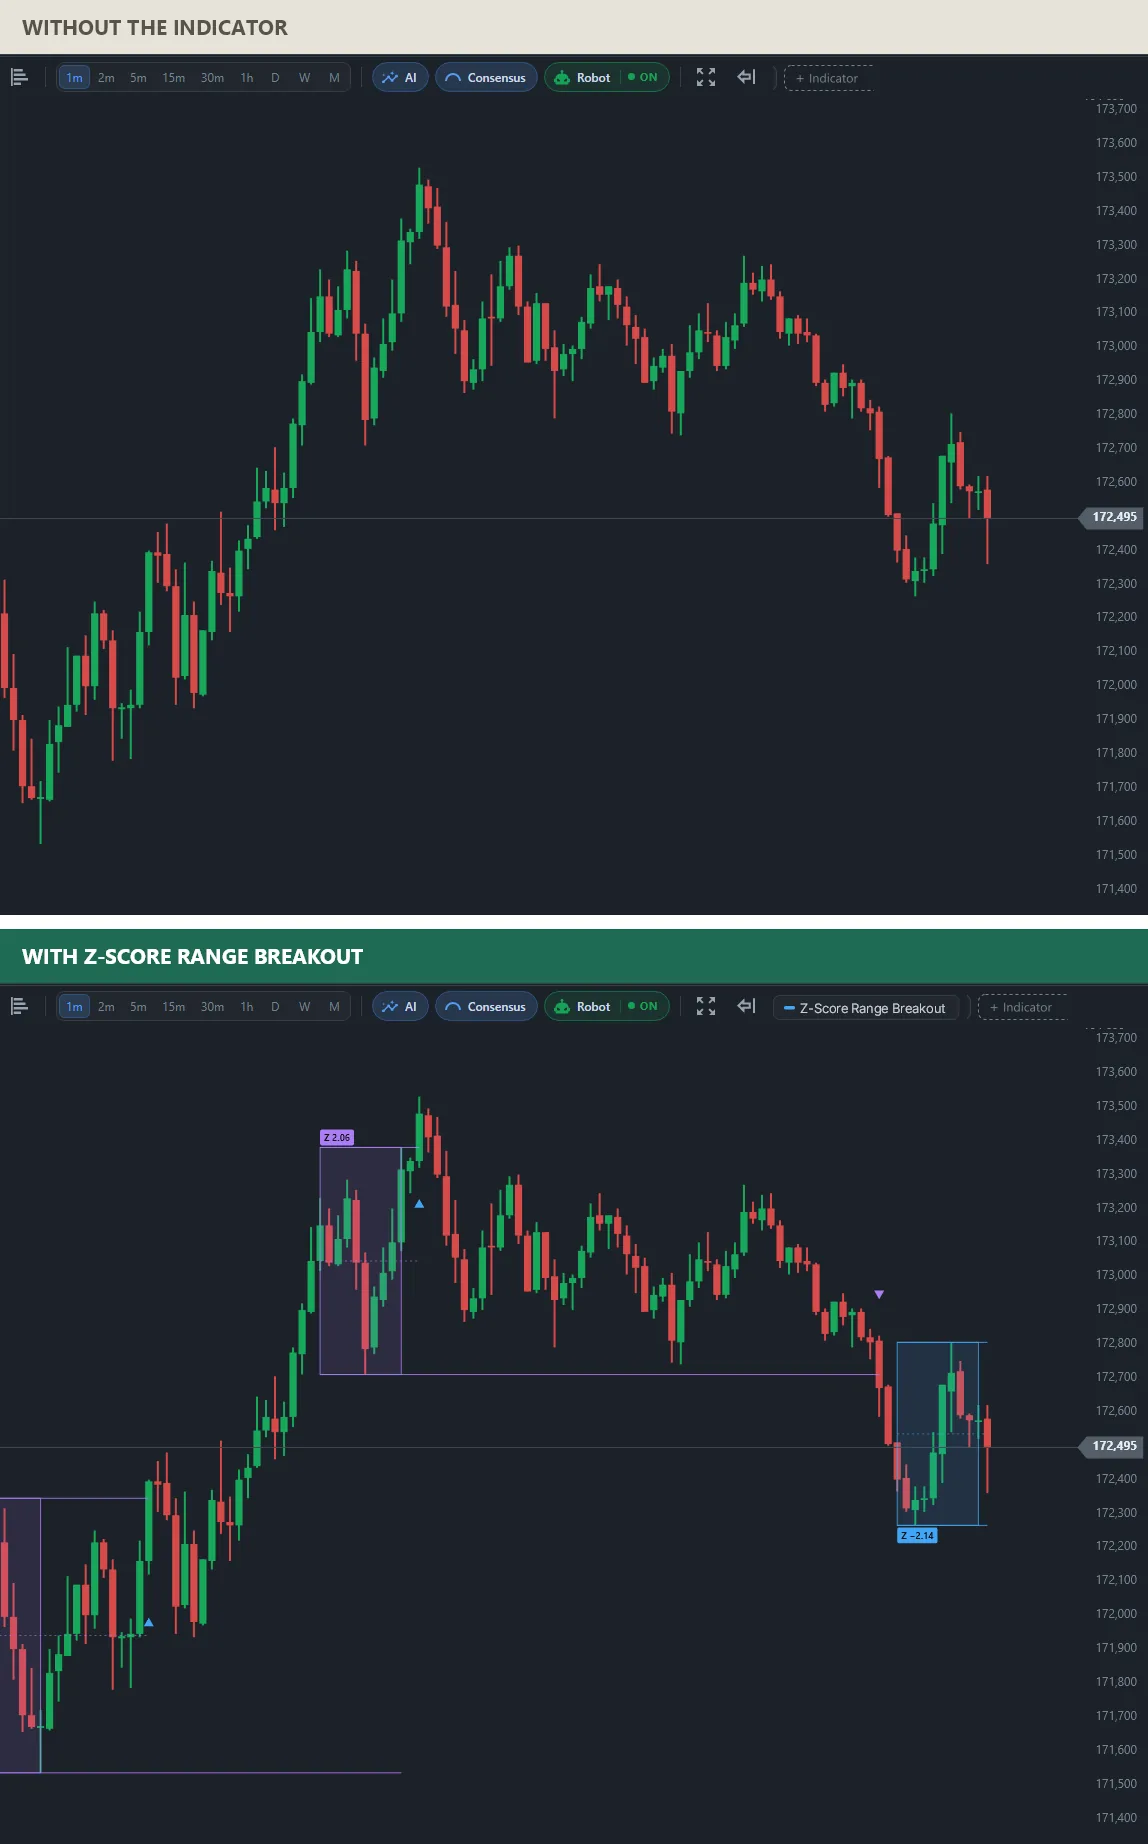
The indicator labels the rally’s stretch with its z-score, Z 2.06, and boxes the area where price settled after it, between about 172,700 and 173,400. The box’s bottom line is projected to the right, and that line is exactly where the afternoon broke down. A new stretch, this time Z −2.14, starts the next box.
Scene 2: a sharp drop and the range that followed it
September 17, 11:30. After two small ranges, the mini index dropped about 2,000 points in a few minutes.
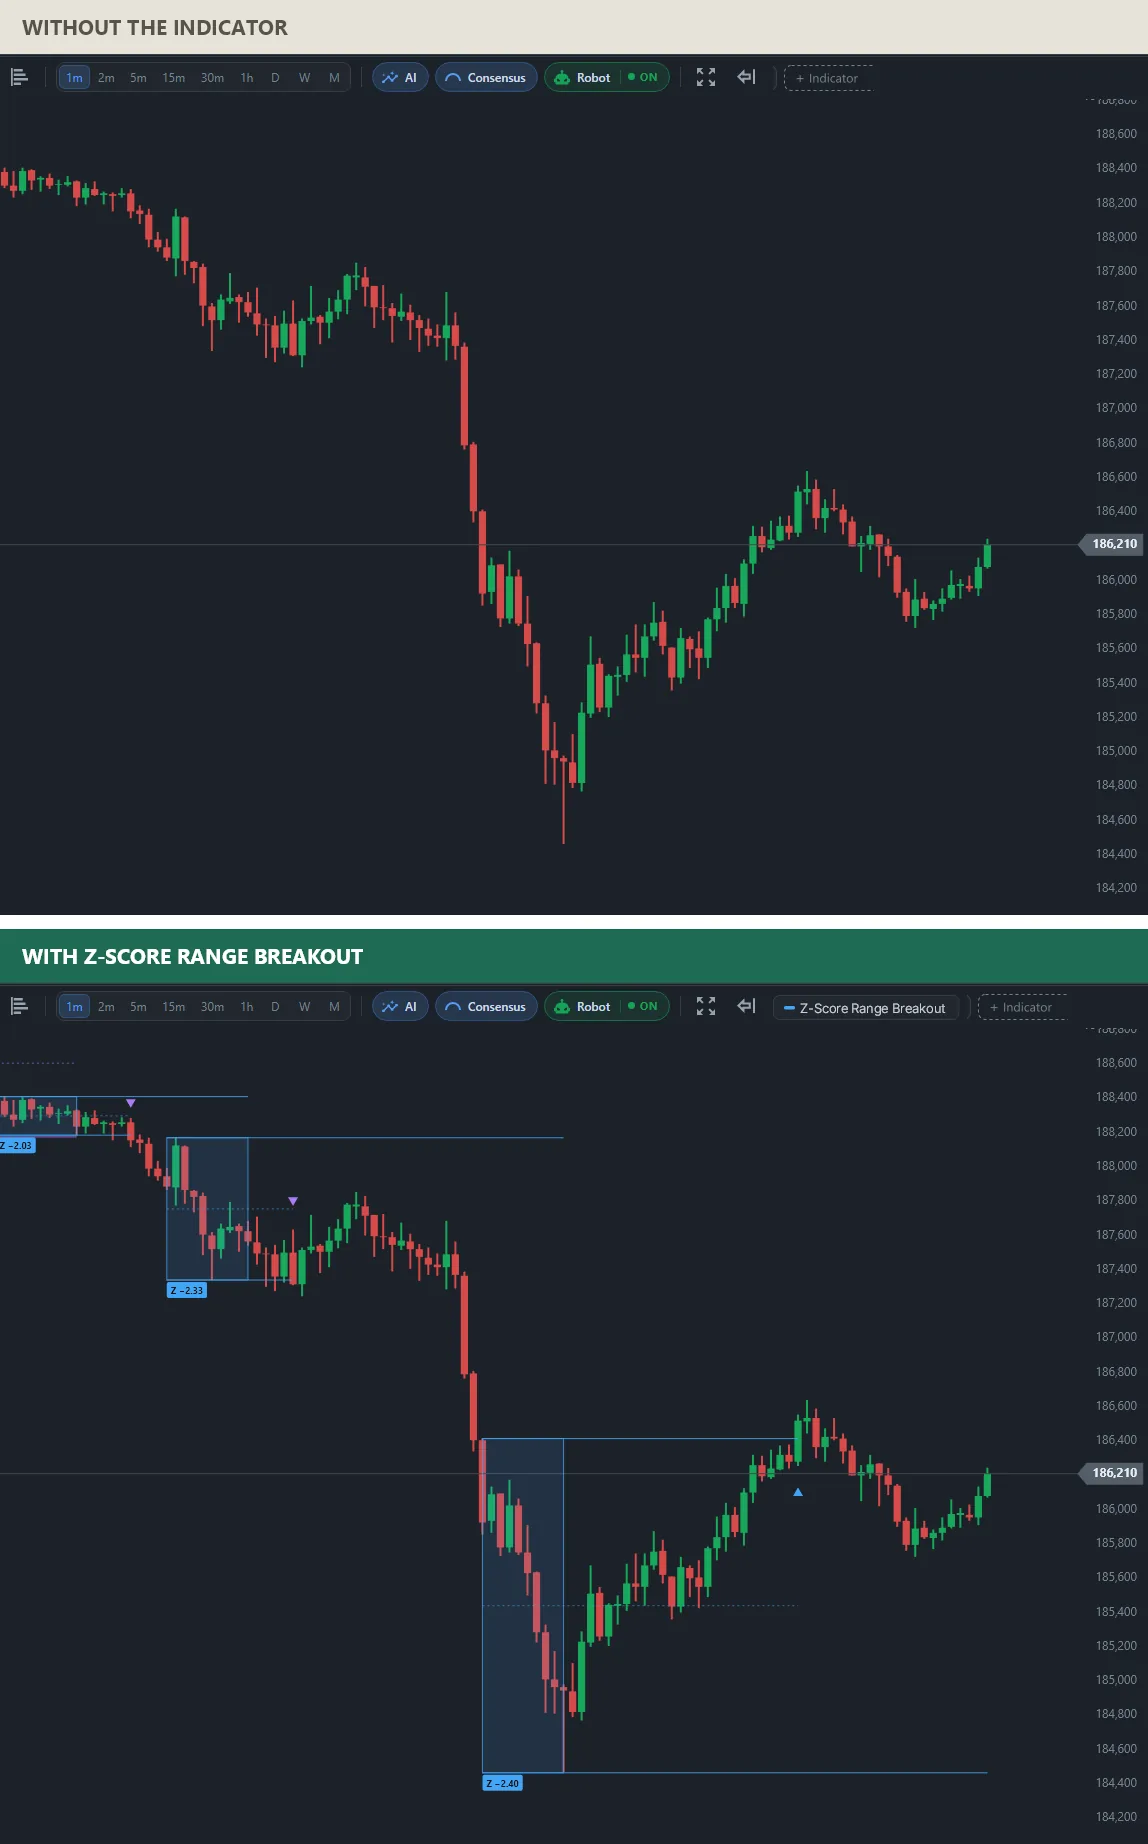
The plain chart shows a crash and a bounce. With the indicator the bounce has a frame: the drop is labeled Z −2.40, the box runs from about 184,550 to 186,450, and the triangle marks the candle where price reached the box’s top. The middle line, about halfway up, is the reference many traders use for partial exits inside the range.
Ranges and breakouts per session on the mini index
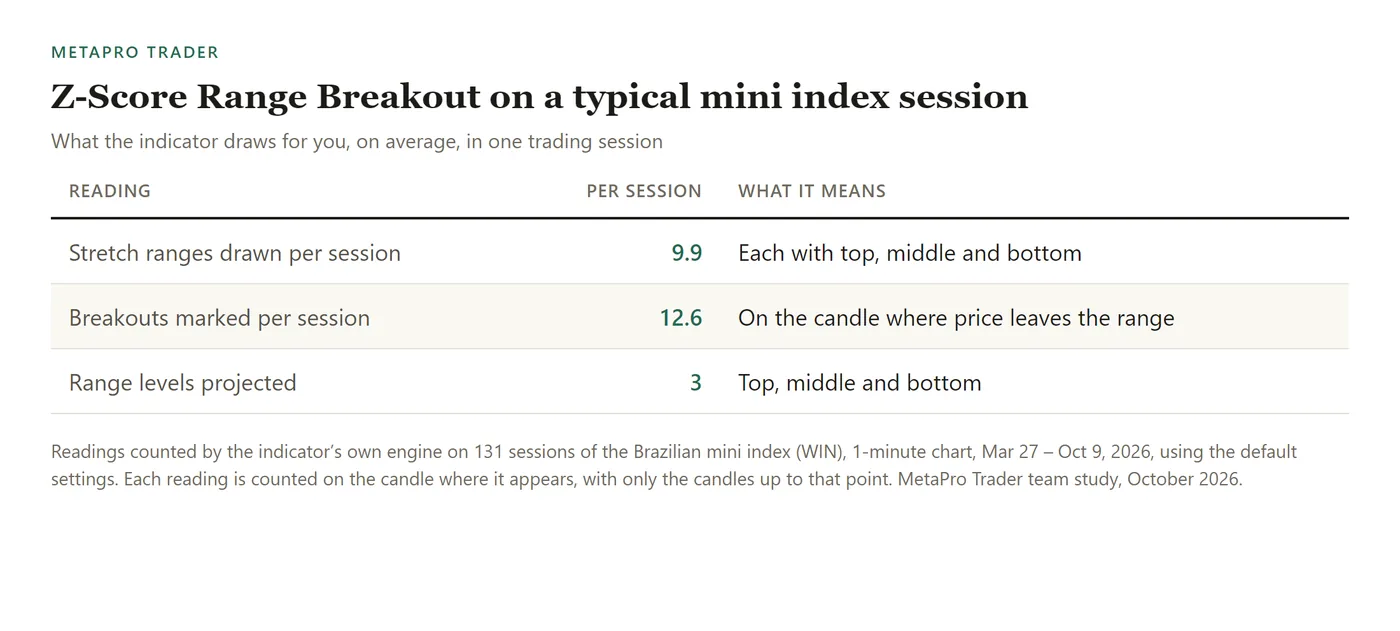
On 131 sessions of the Brazilian mini index (WIN), 1-minute chart, Mar 27 – Oct 9, 2026, Z-Score Range Breakout drew 9.9 stretch ranges and marked 12.6 breakouts per session on average. Each range comes with three projected levels: top, middle and bottom.
How to add the range breakout indicator to MT5
In MetaPro Trader, with your MT5 account connected, open the chart, click + Indicator and choose Z-Score Range Breakout in the Signals tab. Turn on “keep previous ranges” when you want older boxes to stay as reference levels.
This article was written by the MetaPro Trader team. The charts are real mini index sessions drawn by the indicator’s own engine. Trading in financial markets involves risk of loss; the indicator helps you read the chart and does not send orders, and nothing here is investment advice.
Learn more
- Range breakout indicator for MT5 day trading
- Order blocks with volume for MT5
- Automatic support and resistance, scored 0 to 100
- Every indicator in the Signals tab
- Day trading with AI on MT5: MetaPro Trader
Keep reading
- A day trading bot for the mini index: how we test MetaPro Scalp V2 before it goes live
- The Market Breadth Radar MetaTrader 5 Doesn’t Have: Stocks, Dollar and Foreign Indices From Different Brokers on One Chart
- Automatic Fibonacci Indicator for MT5: Day Trading Levels and Targets That Draw Themselves
- Machine Learning Trading Indicator for MT5: AI That Keeps Its Own Score on Screen
- Automatic Stop Loss and Take Profit Indicator for MT5: Trade With the Plan on the Chart
- Buy and Sell Signal Indicator for MT5: See the Turn on the Exact Candle
- Divergence Indicator for MT5: See When a Move Is Running Out of Strength
- Volume Profile Indicator for MT5 Day Trading: Follow the Money, Not Just the Price
- Order Block Indicator With Volume for MT5: Find Where the Big Moves Came From
- Intraday Support and Resistance Indicator for MT5: Start the Session With the Levels Drawn
- Smart Money Concepts Indicator for MT5: Market Structure the Way Professionals Read It
- Automatic Chart Pattern Indicator for MT5: Head and Shoulders, Triangles and Flags Found for You
- Automatic Support and Resistance Indicator for MT5, Scored From 0 to 100
- Buying and Selling Pressure Indicator for MT5: Who Is Running the Market Right Now
- Volume-Based Support and Resistance Indicator for MT5: Levels Confirmed by Real Trading
- Multi-Timeframe Candle Indicator for MT5: The Daily Candle on Your 1-Minute Chart