Indicators
Automatic Chart Pattern Indicator for MT5: Head and Shoulders, Triangles and Flags Found for You
Pattern Geometry finds classic chart patterns on its own and shows the name and the breakout level of each one on your MT5 chart.
The oldest language of technical analysis
Chart patterns are the oldest language of technical analysis and also the easiest to miss. On a 1-minute chart a triangle forms, tightens and breaks in less time than it takes to check another screen.
Pattern Geometry watches for them without a break. It finds triangles, wedges, flags, double tops and bottoms and head and shoulders, outlines each shape with its name, marks the breakout level that turns the pattern into a trade idea and signals when the breakout happens.
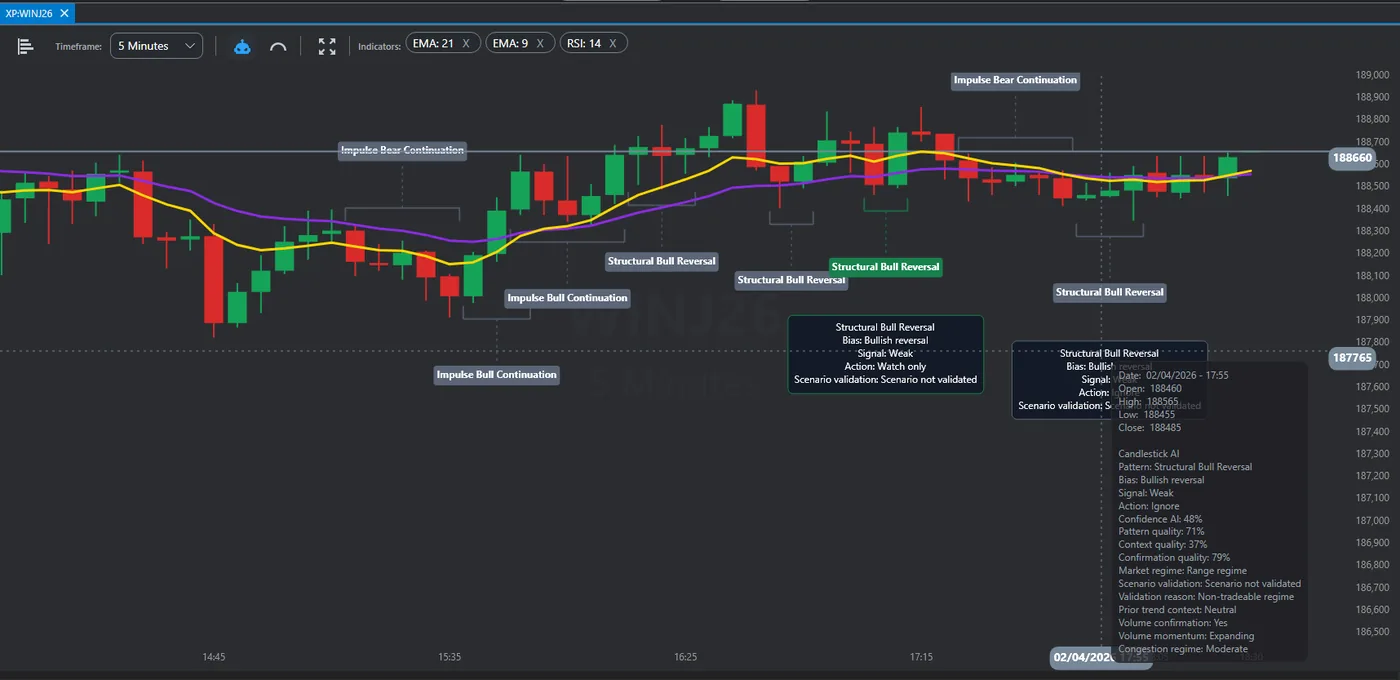
The patterns in this article were drawn in MetaPro Trader, which also has its own AI pattern reading. The AI labels candle patterns such as Impulse Bull Continuation or Structural Bear Reversal and, on each label, shows the bias, the signal strength, the suggested action and whether the scenario was validated. Pattern Geometry reads the shapes of the chart; the AI, prepared for each asset, reads the candles inside them.
Scene 1: three triangles in one afternoon
July 28, 13:30. The mini index went down, up and then started to tighten near 181,415.
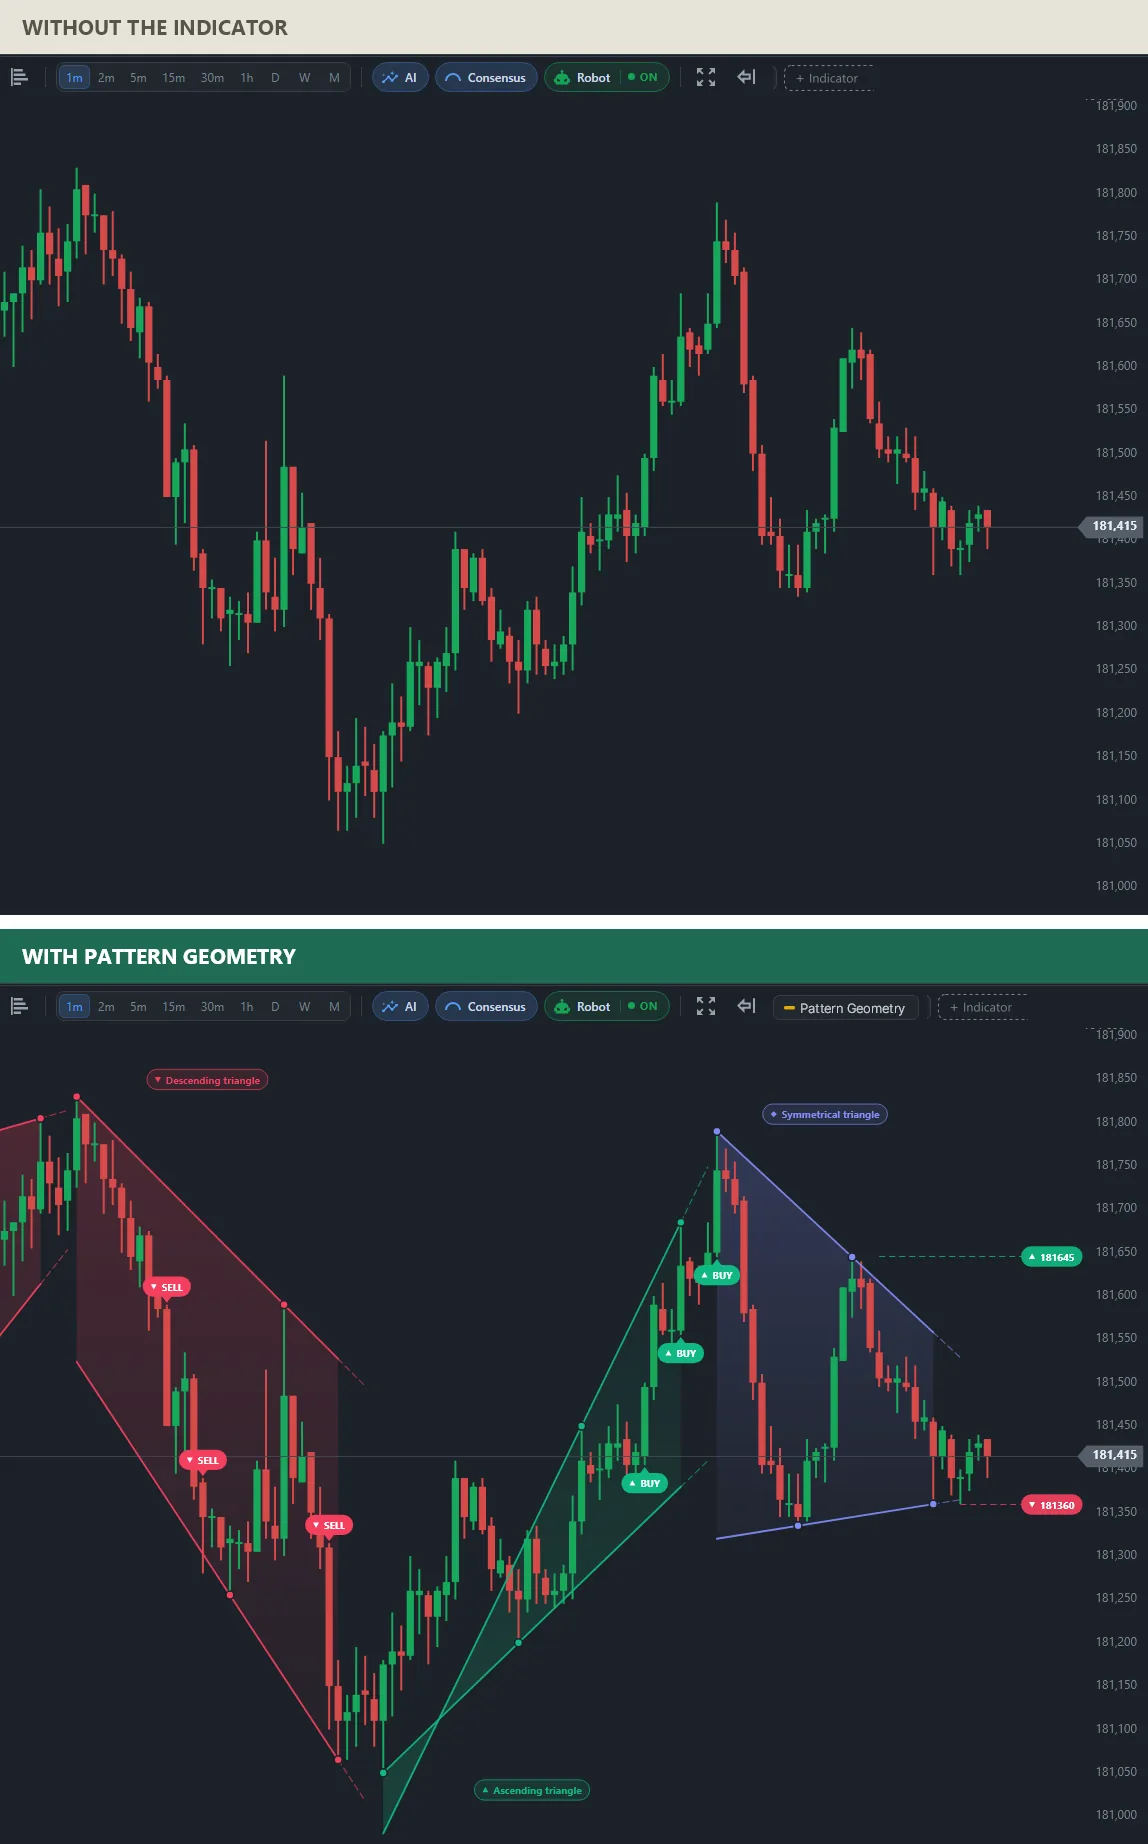
Without the indicator, it is a choppy afternoon. With it, it is three patterns in sequence: a descending triangle during the fall, an ascending triangle during the recovery and a symmetrical triangle forming now. At the right edge the indicator already shows the two levels that decide it: a break above 181,645 for the buy side and below 181,360 for the sell side.
Scene 2: a wedge, an inverse head and shoulders and a triangle
September 8, 12:30. The mini index was drifting lower near 190,735.
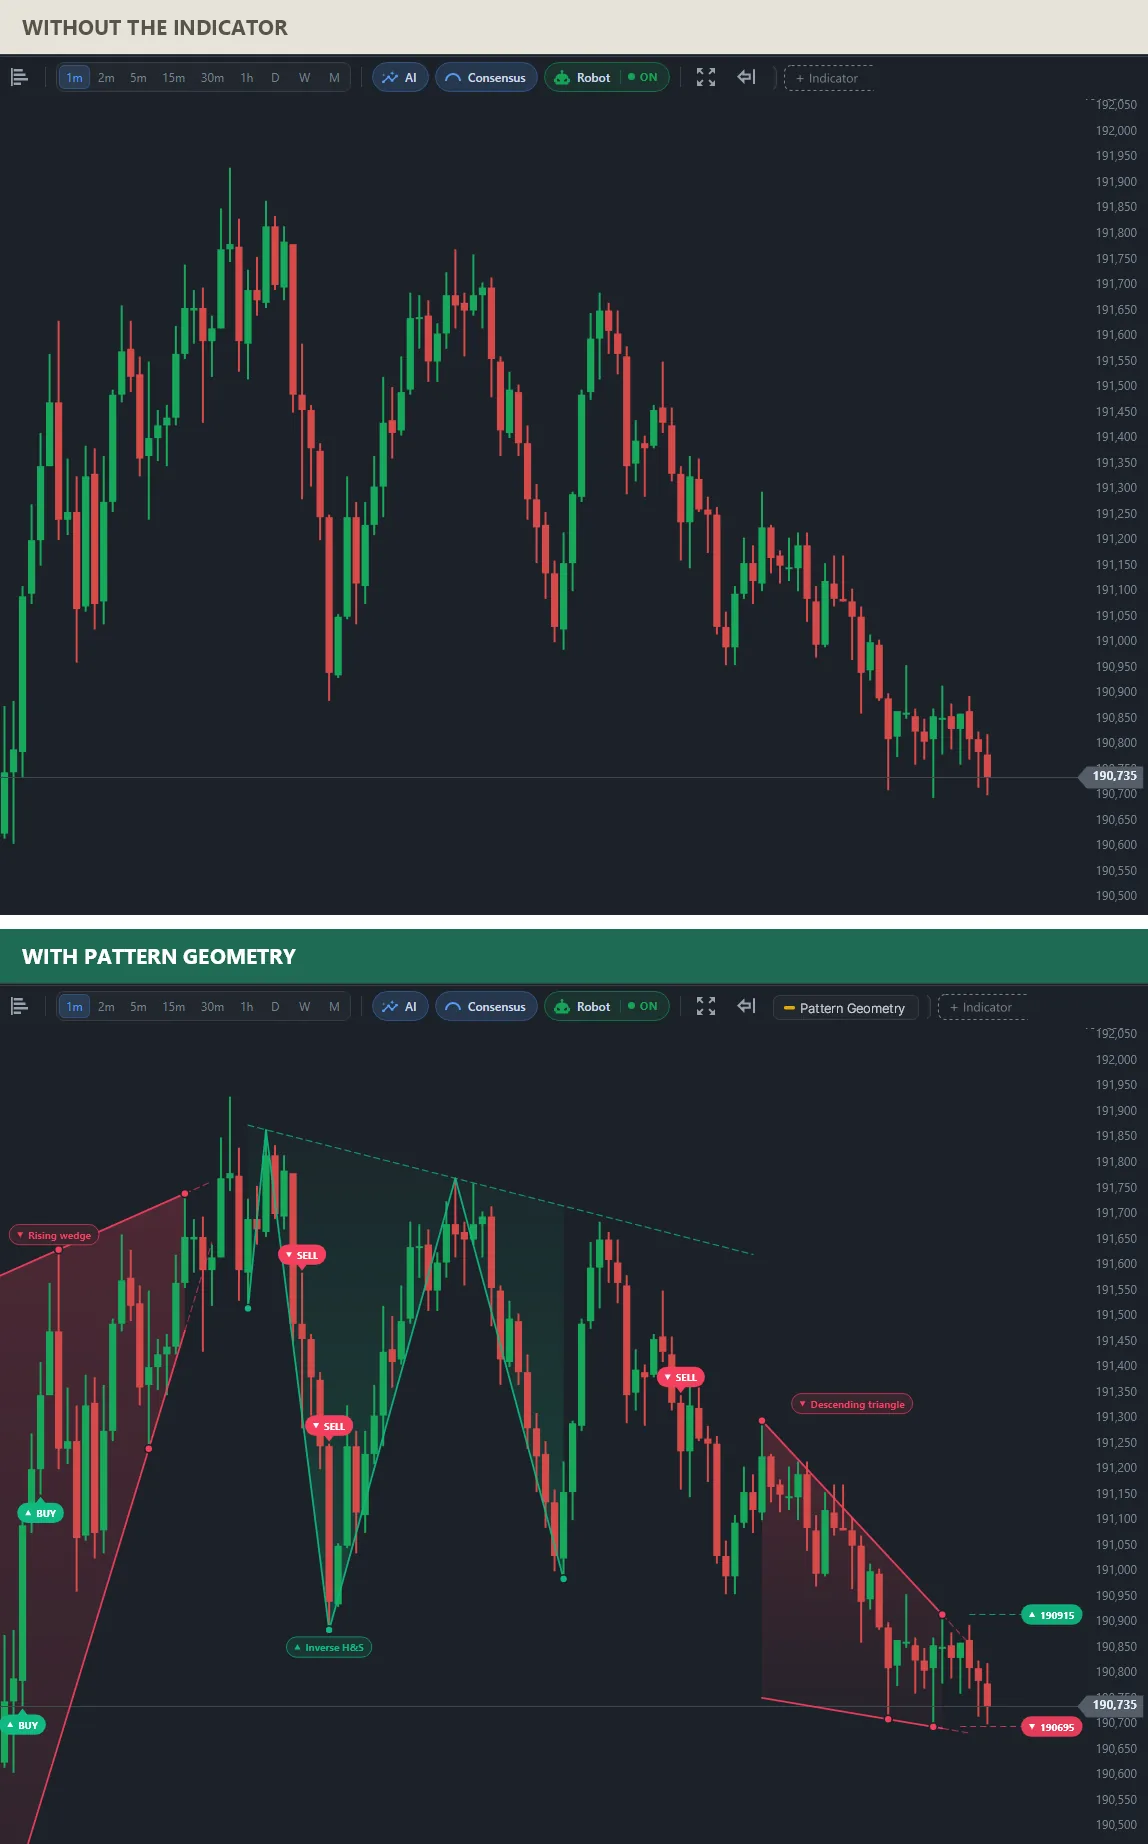
The same few hours hold three classic shapes: a rising wedge, an inverse head and shoulders in the middle and a descending triangle on the right. Each one is named on the chart, and the current one comes with its levels at the edge: 190,915 above and 190,695 below, with price sitting just over the lower one.
Chart patterns found in a single mini index session
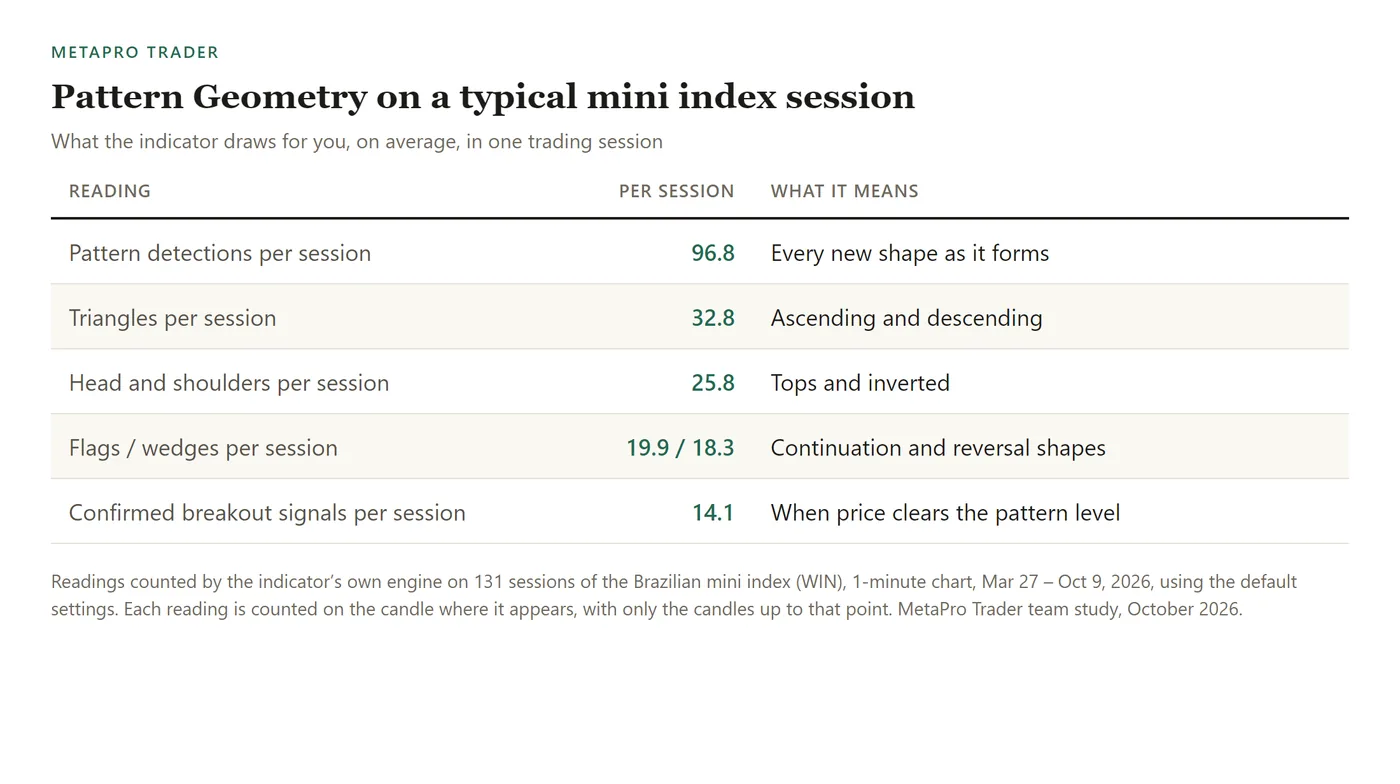
Over 131 sessions of the Brazilian mini index (WIN), 1-minute chart, Mar 27 – Oct 9, 2026, Pattern Geometry made 96.8 pattern detections per session on average, including 32.8 triangles and 25.8 head and shoulders, and gave 14.1 confirmed breakout signals.
How to add the automatic chart pattern indicator to MT5
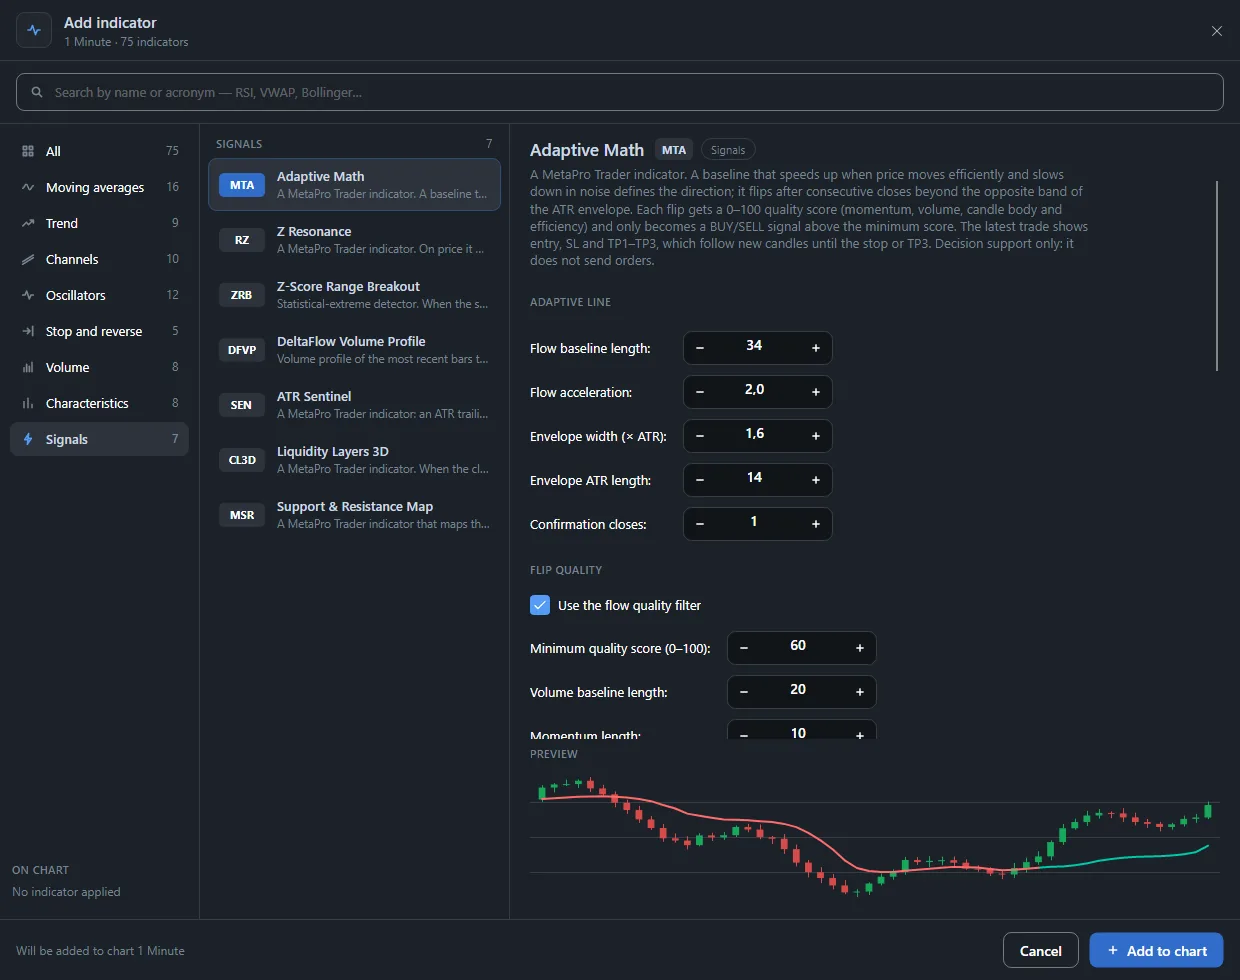
Open MetaPro Trader with MT5 connected, open the chart and click + Indicator. In the Signals tab, choose Pattern Geometry. Limit the number of shapes on screen to keep only the most recent patterns, and watch the levels at the right edge: that is where a pattern becomes a decision.
The MetaPro Trader team wrote this article using real mini index data. The indicator is a reading tool: it does not trade for you, past charts do not predict future ones, and trading carries risk of loss.
Learn more
- Automatic chart pattern indicator for MT5
- Market structure with Smart Money Concepts
- A range breakout indicator for MT5
- All day trading indicators for MT5
- MetaPro Trader: AI day trading platform for MT5
Keep reading
- A day trading bot for the mini index: how we test MetaPro Scalp V2 before it goes live
- The Market Breadth Radar MetaTrader 5 Doesn’t Have: Stocks, Dollar and Foreign Indices From Different Brokers on One Chart
- Automatic Fibonacci Indicator for MT5: Day Trading Levels and Targets That Draw Themselves
- Machine Learning Trading Indicator for MT5: AI That Keeps Its Own Score on Screen
- Automatic Stop Loss and Take Profit Indicator for MT5: Trade With the Plan on the Chart
- Buy and Sell Signal Indicator for MT5: See the Turn on the Exact Candle
- Divergence Indicator for MT5: See When a Move Is Running Out of Strength
- Range Breakout Indicator for MT5: Catch the Breakout the Moment It Happens
- Volume Profile Indicator for MT5 Day Trading: Follow the Money, Not Just the Price
- Order Block Indicator With Volume for MT5: Find Where the Big Moves Came From
- Intraday Support and Resistance Indicator for MT5: Start the Session With the Levels Drawn
- Smart Money Concepts Indicator for MT5: Market Structure the Way Professionals Read It
- Automatic Support and Resistance Indicator for MT5, Scored From 0 to 100
- Buying and Selling Pressure Indicator for MT5: Who Is Running the Market Right Now
- Volume-Based Support and Resistance Indicator for MT5: Levels Confirmed by Real Trading
- Multi-Timeframe Candle Indicator for MT5: The Daily Candle on Your 1-Minute Chart