Indicators
Smart Money Concepts Indicator for MT5: Market Structure the Way Professionals Read It
Structure Cartographer marks BOS, CHoCH, order blocks, fair value gaps and premium/discount zones candle by candle.
Market structure without the minutes it takes
Professional traders read structure before anything else: which highs and lows matter, whether the last break continued the trend or changed its character, and where the orders that started the move were placed. Doing that by hand takes minutes per chart, and the 1-minute chart redraws it all in seconds.
Structure Cartographer draws that map candle by candle, using the Smart Money Concepts vocabulary: breaks of structure (BOS), changes of character (CHoCH), equal highs and lows, order blocks and fair value gaps, plus the premium and discount areas of the current move.
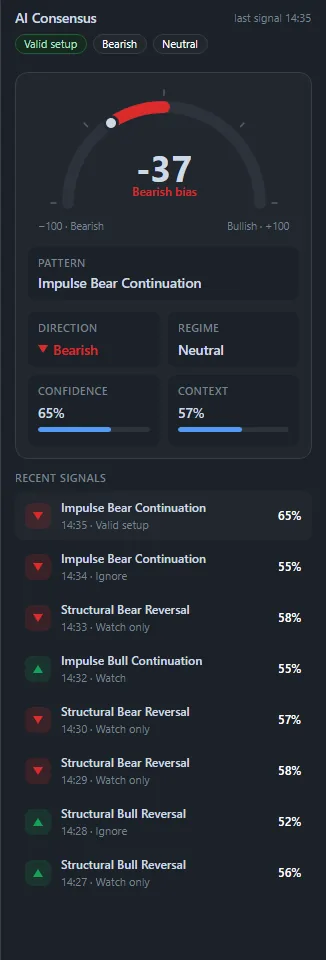
Structure Cartographer is part of MetaPro Trader, a day trading platform for MT5 whose AI is prepared for each asset before it reads a single candle. Its Consensus panel turns that reading into a bias from −100 to +100, with the pattern, direction, regime and confidence, and lists the latest signals with their time and status. You get the structure on the chart and what the AI sees in it, side by side.
Scene 1: a change of character after a long fall
August 4, noon. The mini index had fallen from about 184,800 to 182,250.
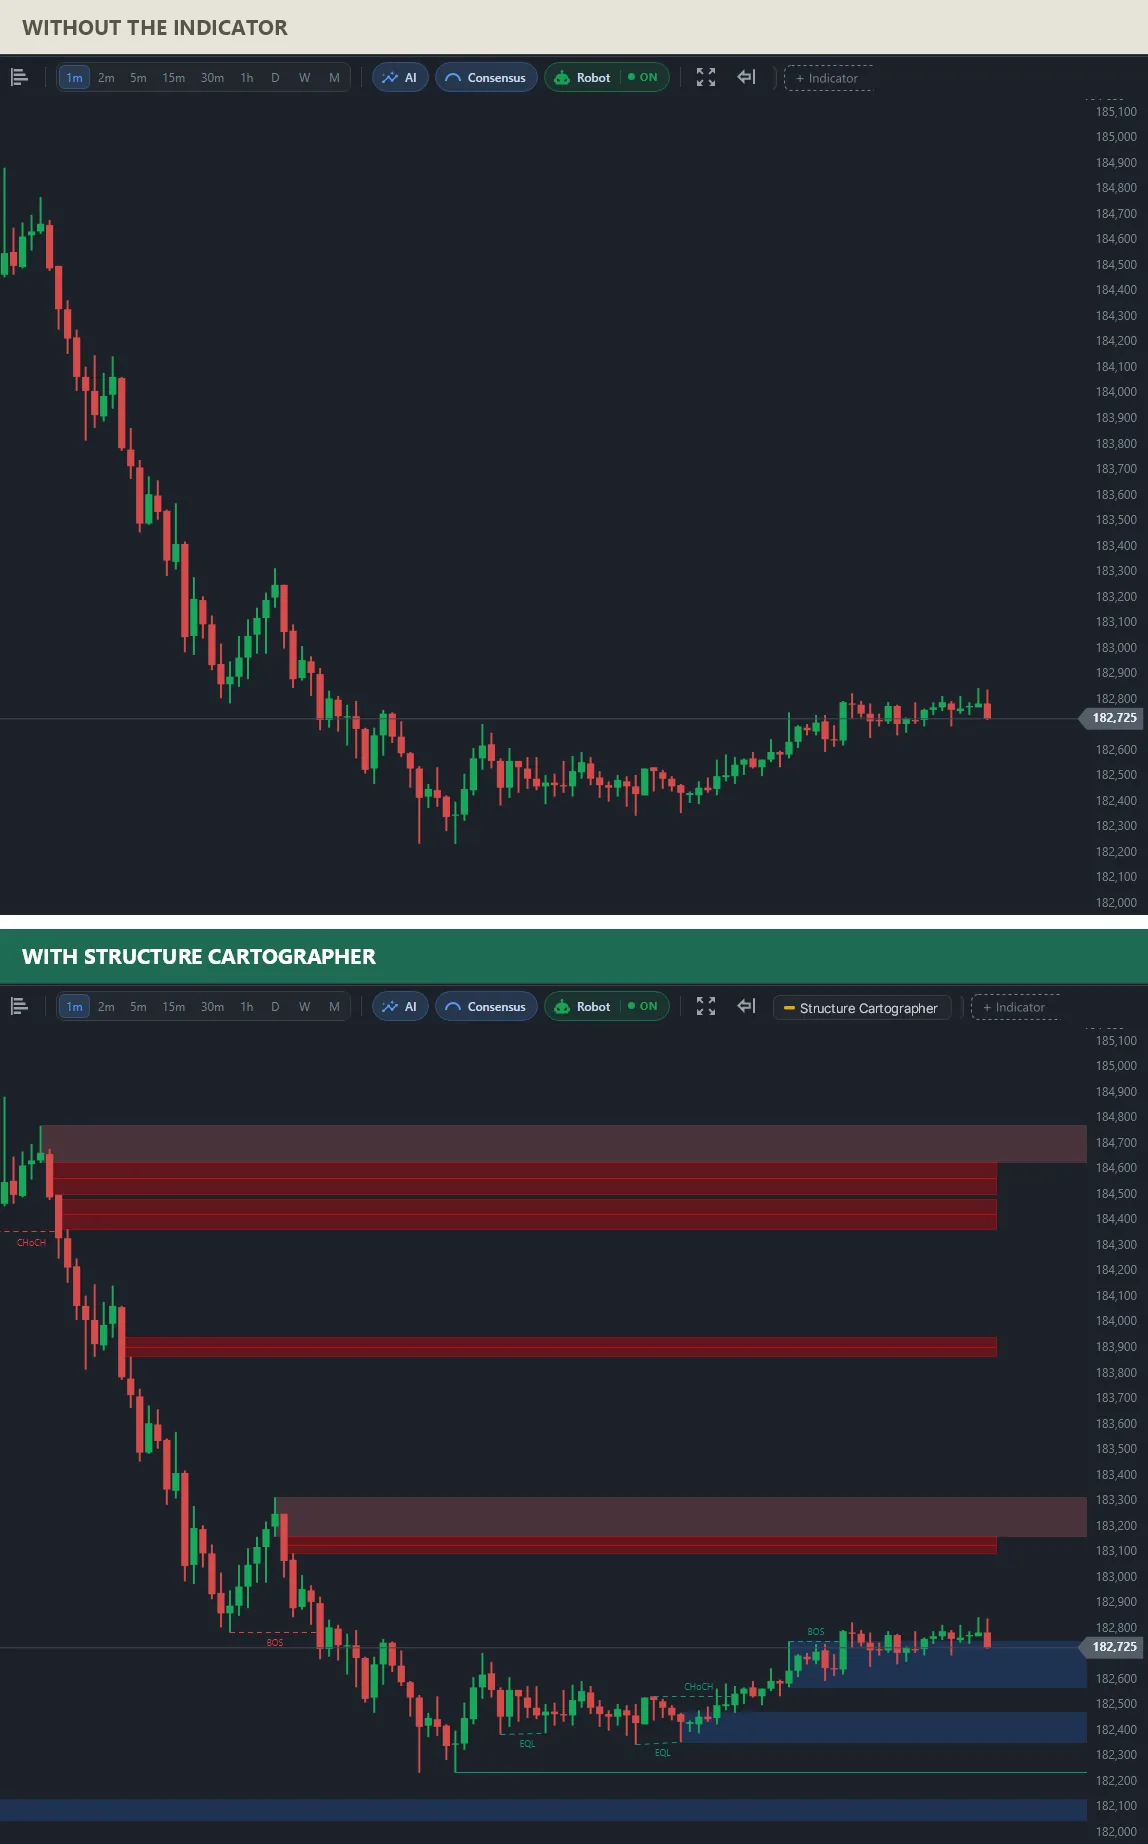
The labels tell the story in order. A red CHoCH at the top starts the fall and a red BOS confirms it. Near the bottom, two EQL labels mark equal lows, the kind of place where stops pile up. Then the character changes: a green CHoCH and a green BOS, with blue zones forming under price. The red zones above stay on the chart as the areas the fall came from.
Scene 2: a trend that keeps breaking structure
September 3, 13:30. The mini index was in a steady decline towards 187,380.
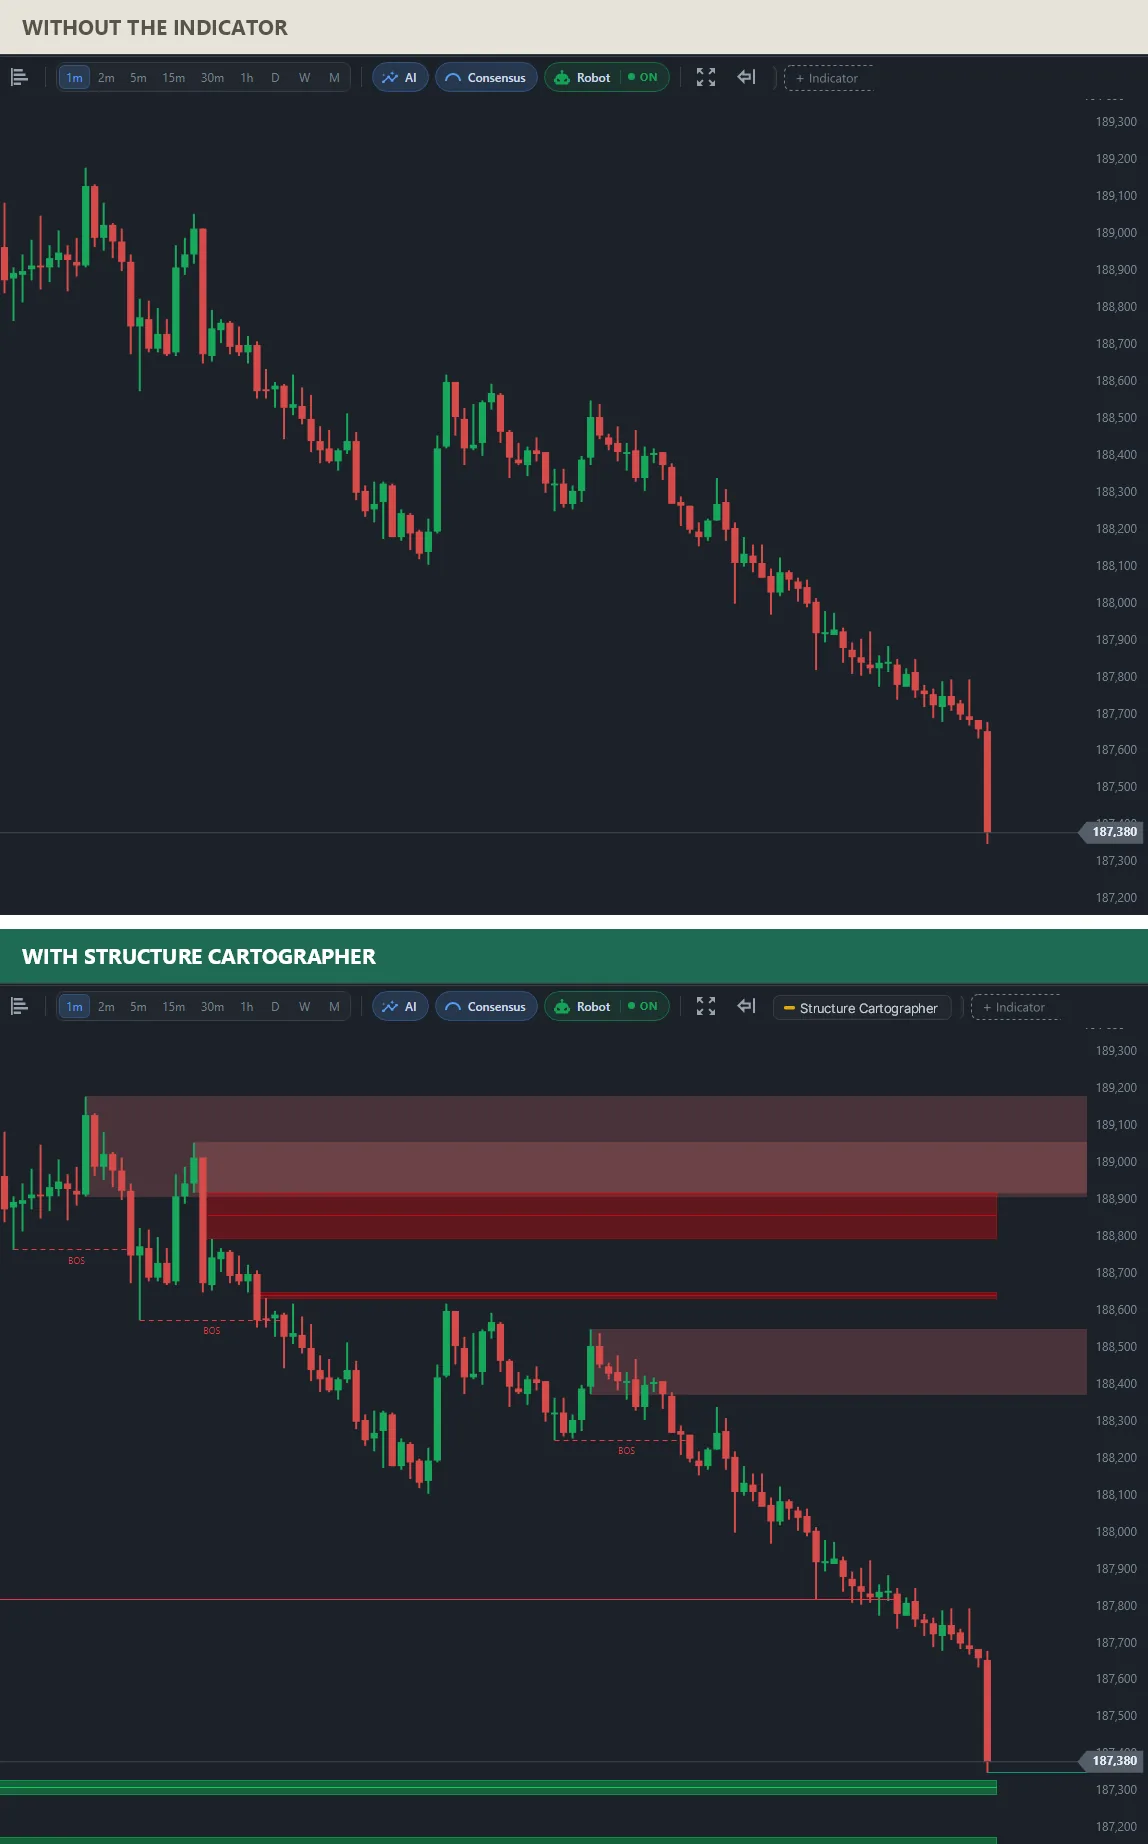
This scene is the opposite of the first one. There is no change of character, only one BOS after another: each bounce made a lower high and each new low broke the previous one. The red zones above price mark where the selling came from, and the green band below is an imbalance still open under the market.
How much market structure one mini index session produces
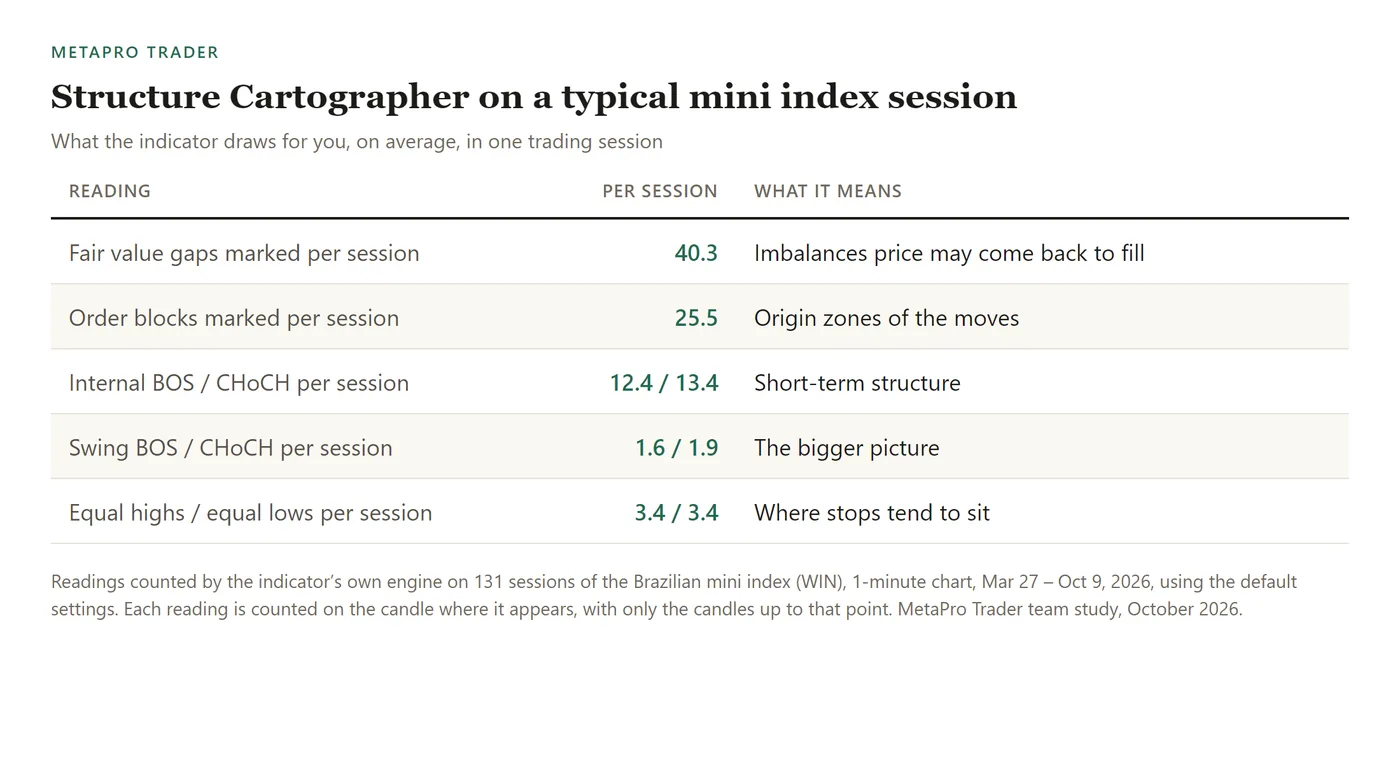
On 131 sessions of the Brazilian mini index (WIN), 1-minute chart, Mar 27 – Oct 9, 2026, Structure Cartographer marked 40.3 fair value gaps and 25.5 order blocks per session on average, with 12.4 internal breaks of structure and 1.6 swing breaks. The swing labels are few, and that is why they set the direction.
How to add the Smart Money Concepts indicator to MT5
Connect your MetaTrader 5 account in MetaPro Trader, open the chart, click + Indicator and pick Structure Cartographer in the Signals tab. Read swing structure first and internal structure second; pending fair value gaps extend to the current candle, so you always see which ones are still open.
Written by the MetaPro Trader team. Every chart above is a real 1-minute mini index session, drawn by the same engine that runs in the platform. The indicator does not place orders and is not a recommendation; trading carries risk of loss.
Learn more
- Smart Money Concepts indicator for MT5
- Order blocks with volume for MT5
- Automatic chart patterns on MT5
- Every indicator in the Signals tab
- Day trading with AI on MT5: MetaPro Trader
Keep reading
- A day trading bot for the mini index: how we test MetaPro Scalp V2 before it goes live
- The Market Breadth Radar MetaTrader 5 Doesn’t Have: Stocks, Dollar and Foreign Indices From Different Brokers on One Chart
- Automatic Fibonacci Indicator for MT5: Day Trading Levels and Targets That Draw Themselves
- Machine Learning Trading Indicator for MT5: AI That Keeps Its Own Score on Screen
- Automatic Stop Loss and Take Profit Indicator for MT5: Trade With the Plan on the Chart
- Buy and Sell Signal Indicator for MT5: See the Turn on the Exact Candle
- Divergence Indicator for MT5: See When a Move Is Running Out of Strength
- Range Breakout Indicator for MT5: Catch the Breakout the Moment It Happens
- Volume Profile Indicator for MT5 Day Trading: Follow the Money, Not Just the Price
- Order Block Indicator With Volume for MT5: Find Where the Big Moves Came From
- Intraday Support and Resistance Indicator for MT5: Start the Session With the Levels Drawn
- Automatic Chart Pattern Indicator for MT5: Head and Shoulders, Triangles and Flags Found for You
- Automatic Support and Resistance Indicator for MT5, Scored From 0 to 100
- Buying and Selling Pressure Indicator for MT5: Who Is Running the Market Right Now
- Volume-Based Support and Resistance Indicator for MT5: Levels Confirmed by Real Trading
- Multi-Timeframe Candle Indicator for MT5: The Daily Candle on Your 1-Minute Chart