Indicators
Automatic Support and Resistance Indicator for MT5, Scored From 0 to 100
S/R Zone Ranking finds support and resistance zones on its own, scores each one and shows only the strongest, numbered by importance.
When every line looks important
Draw every support and resistance level you can find and the chart turns into a barcode. When every line looks important, none of them is, and the decision comes down to a guess.
S/R Zone Ranking solves that by ranking. It finds the zones on its own, gives each one a score from 0 to 100 and shows only the strongest, numbered by importance, with a status that tells you whether the zone is intact or has already been tested.
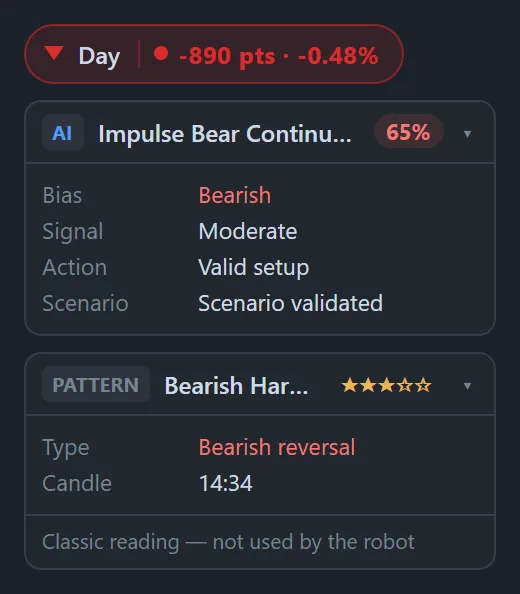
MetaPro Trader, the platform behind these screens, keeps a reading panel in the corner of the chart. One card shows the AI’s latest pattern on this asset with its bias, signal, action and scenario; another shows the classic candlestick pattern, rated with stars; the day’s change sits on top. It is a summary of the chart in three lines, before you even look at the zones.
Scene 1: from the top resistance to a tested support
August 18, noon. The mini index rallied to 171,500 and then fell almost 1,800 points.
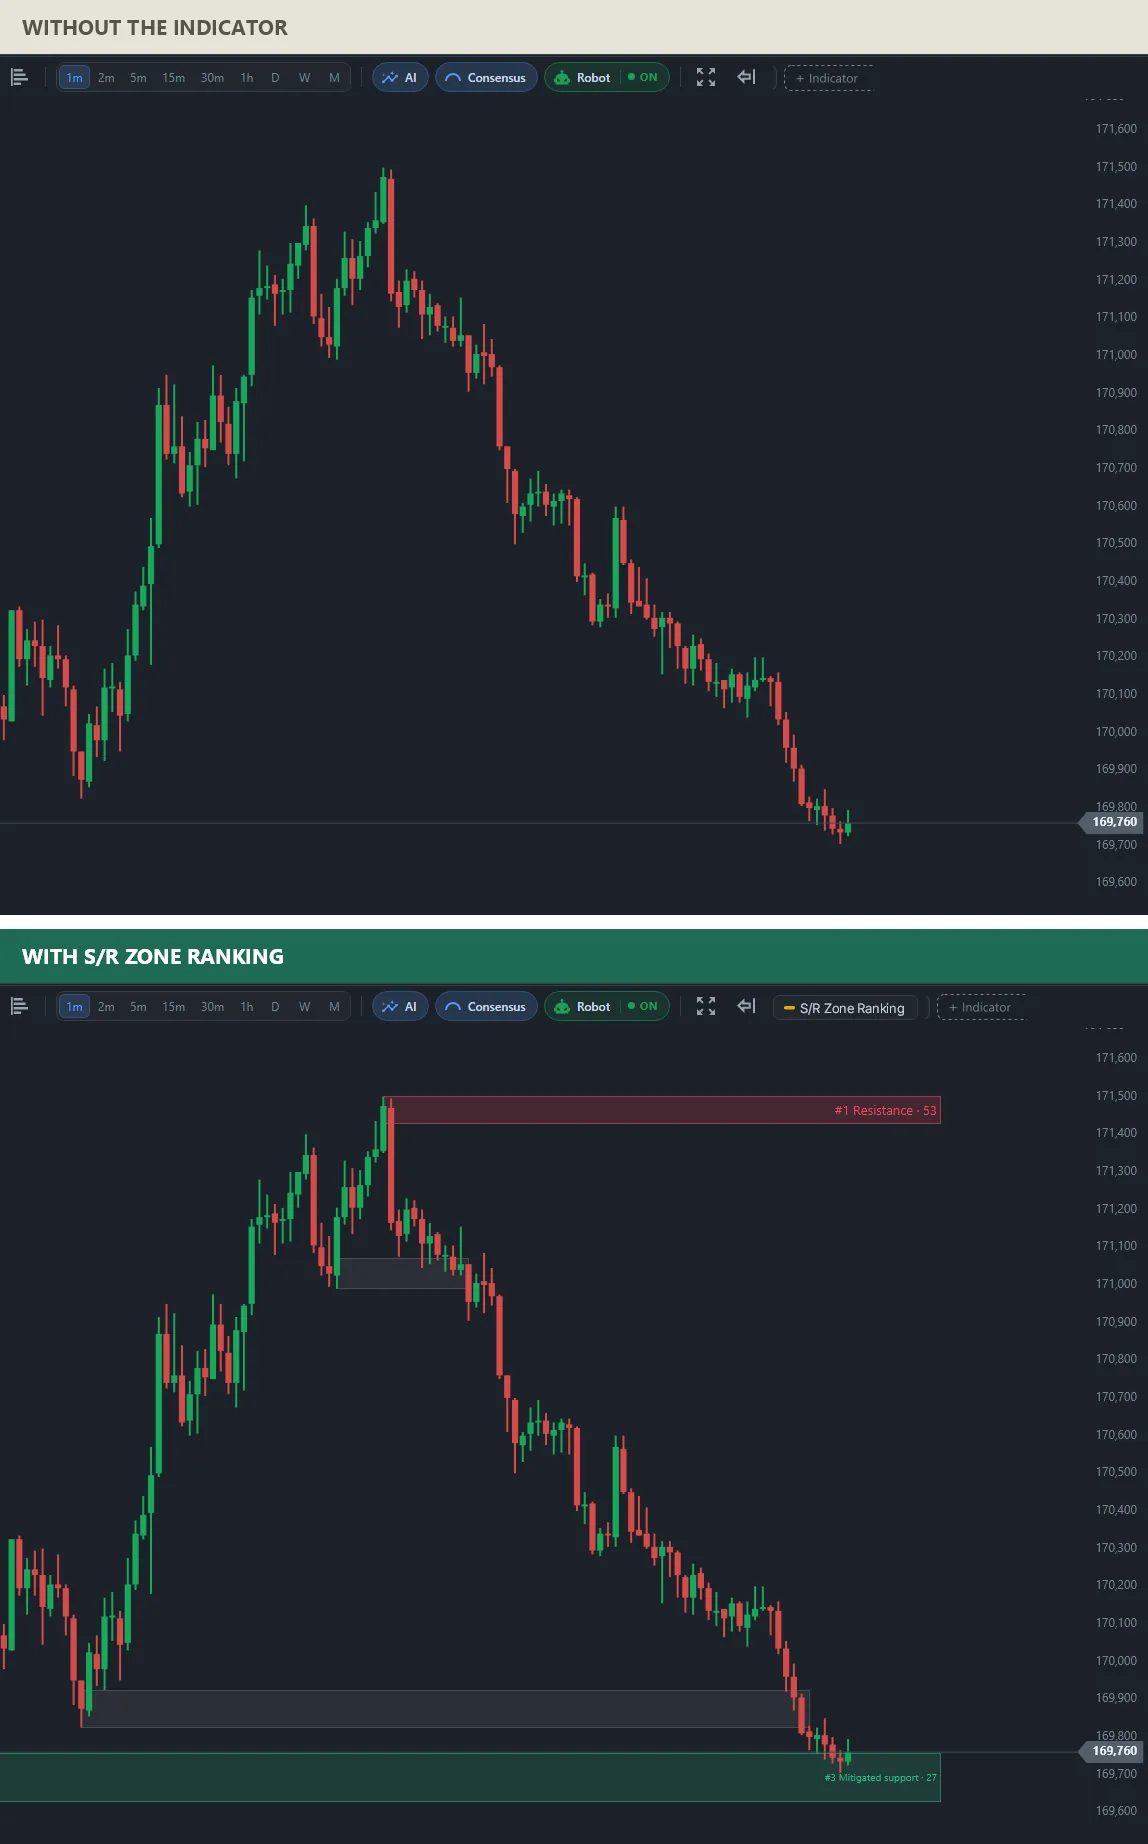
Instead of a dozen lines, the chart has a ranking. #1 Resistance · 53 sits at the high of the day. Price is now on #3 Mitigated support · 27, a zone that was already tested and kept only a low score, which is the indicator’s way of saying it is weaker than it looks. The gray boxes are zones that no longer make the ranking and stay on the chart as a light reference.
Scene 2: price boxed between the two best zones
September 11, 13:00. The mini index was trading in the middle of a range near 189,335.
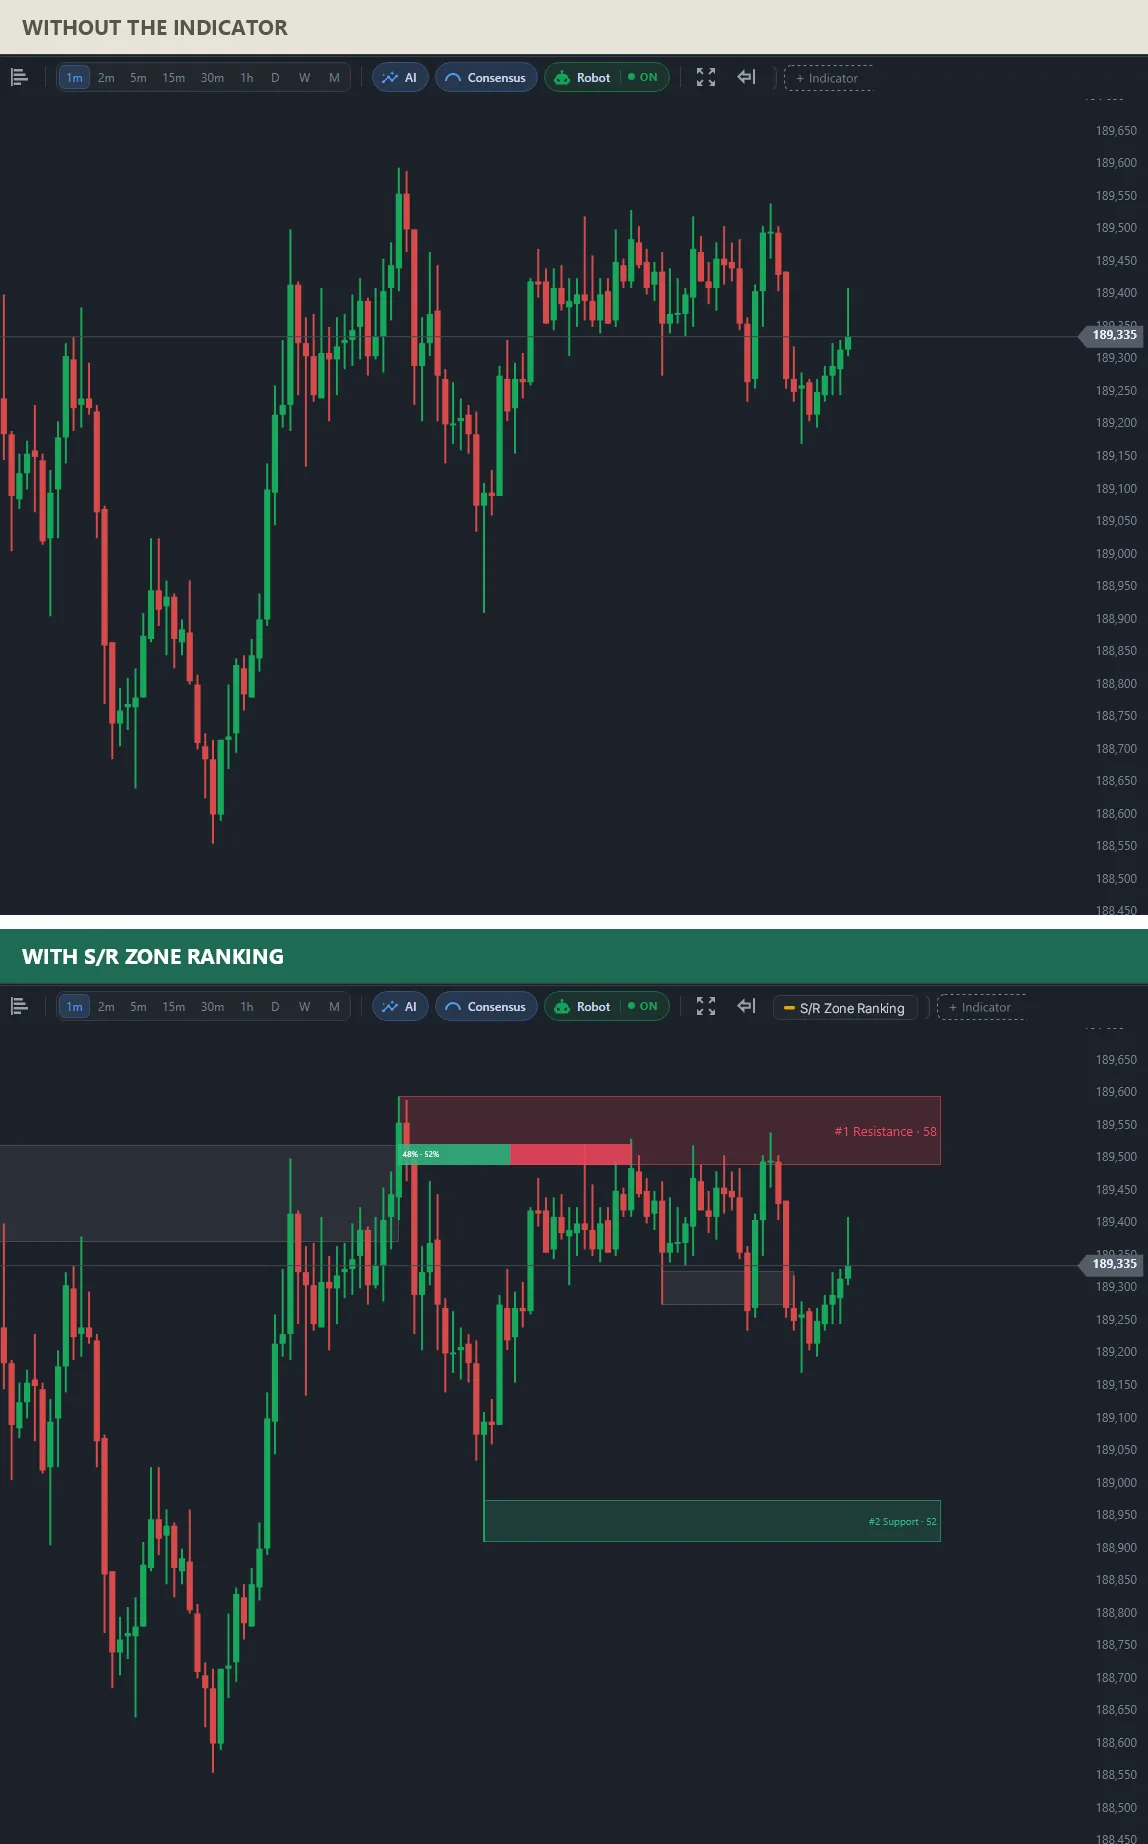
Here the two best zones frame the session: #1 Resistance · 58 between about 189,500 and 189,600, with a strength bar split 48%/52%, and #2 Support · 52 near 188,900–188,950. Price is in between, and the ranking tells you which edge has the stronger case.
Support and resistance zones scored in one mini index session
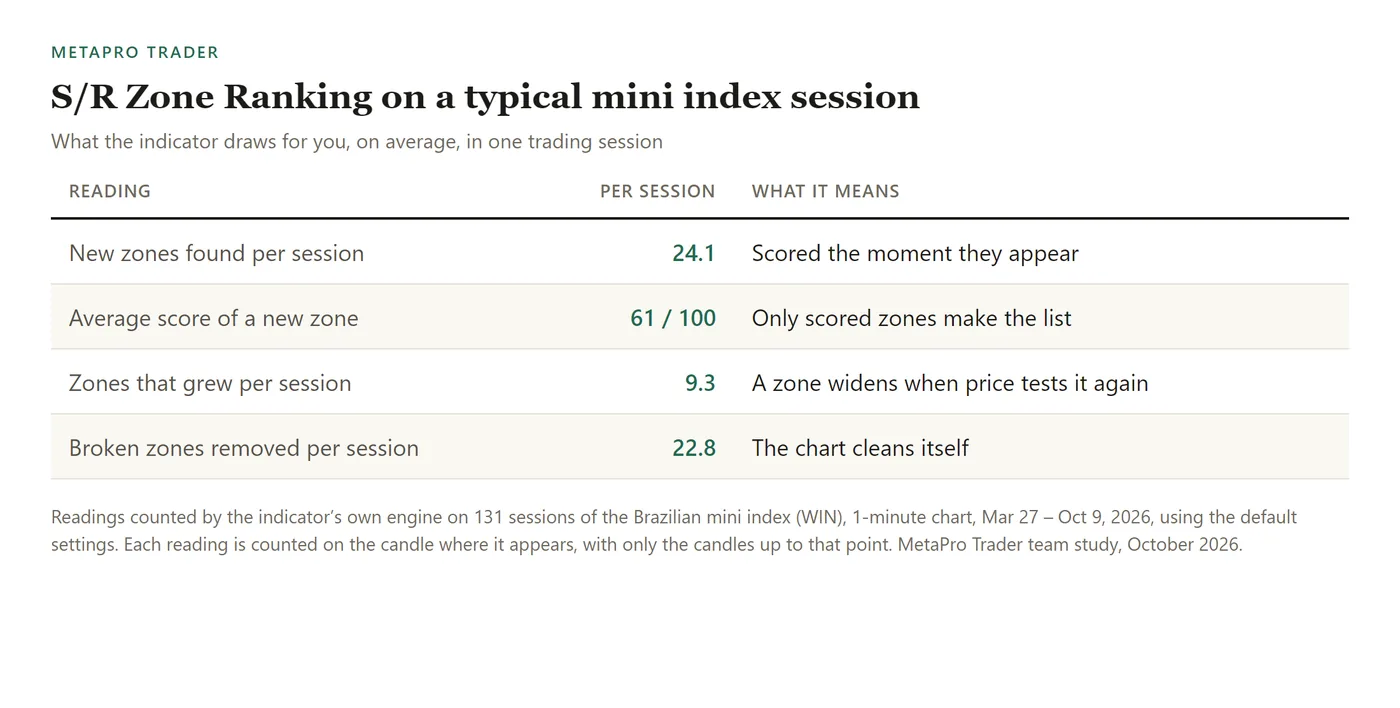
Over 131 sessions of the Brazilian mini index (WIN), 1-minute chart, Mar 27 – Oct 9, 2026, S/R Zone Ranking found 24.1 new zones per session, with an average score of 61 out of 100, and removed 22.8 broken zones per session so the chart cleans itself.
How to add the automatic support and resistance indicator to MT5
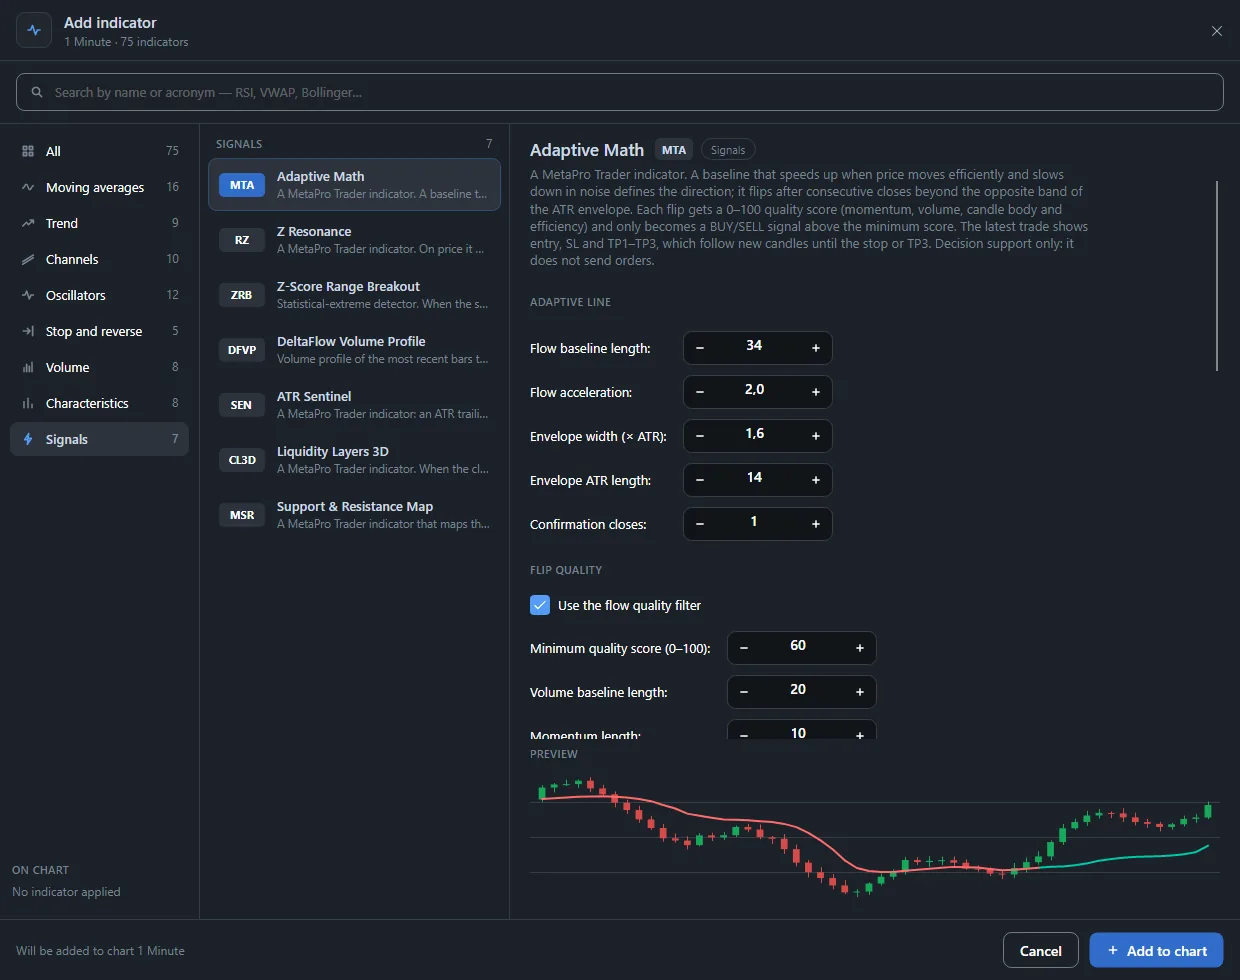
With MetaTrader 5 connected in MetaPro Trader, open the chart, click + Indicator and choose S/R Zone Ranking in the Signals tab. Show only the top 3 zones for the cleanest reading; a zone that keeps its score after a test is one to keep an eye on.
This article was written by the MetaPro Trader team. The charts are real mini index sessions drawn by the indicator’s own engine. Trading in financial markets involves risk of loss; the indicator helps you read the chart and does not send orders, and nothing here is investment advice.
Learn more
- Automatic support and resistance indicator for MT5
- Support and resistance confirmed by volume
- Intraday support and resistance for MT5
- The full list of MetaPro Trader indicators
- MetaPro Trader for MetaTrader 5
Keep reading
- A day trading bot for the mini index: how we test MetaPro Scalp V2 before it goes live
- The Market Breadth Radar MetaTrader 5 Doesn’t Have: Stocks, Dollar and Foreign Indices From Different Brokers on One Chart
- Automatic Fibonacci Indicator for MT5: Day Trading Levels and Targets That Draw Themselves
- Machine Learning Trading Indicator for MT5: AI That Keeps Its Own Score on Screen
- Automatic Stop Loss and Take Profit Indicator for MT5: Trade With the Plan on the Chart
- Buy and Sell Signal Indicator for MT5: See the Turn on the Exact Candle
- Divergence Indicator for MT5: See When a Move Is Running Out of Strength
- Range Breakout Indicator for MT5: Catch the Breakout the Moment It Happens
- Volume Profile Indicator for MT5 Day Trading: Follow the Money, Not Just the Price
- Order Block Indicator With Volume for MT5: Find Where the Big Moves Came From
- Intraday Support and Resistance Indicator for MT5: Start the Session With the Levels Drawn
- Smart Money Concepts Indicator for MT5: Market Structure the Way Professionals Read It
- Automatic Chart Pattern Indicator for MT5: Head and Shoulders, Triangles and Flags Found for You
- Buying and Selling Pressure Indicator for MT5: Who Is Running the Market Right Now
- Volume-Based Support and Resistance Indicator for MT5: Levels Confirmed by Real Trading
- Multi-Timeframe Candle Indicator for MT5: The Daily Candle on Your 1-Minute Chart