Indicators
Automatic Stop Loss and Take Profit Indicator for MT5: Trade With the Plan on the Chart
Adaptive Math draws the stop loss and three take profit targets on every buy and sell signal, with a quality score from 0 to 100.
Why an entry without a plan costs money
Ask a losing day trader where their stop was and you often get a pause. The entry was clear; the exit was improvised. The stop moved once, then again, and the target was “wherever it felt good”. Most of the damage in day trading happens in that improvised part.
Adaptive Math is built for the opposite routine: the plan comes first. Every buy or sell signal arrives with its entry, a stop loss and three take profit targets already drawn on the candles, plus a quality score from 0 to 100, so you know where you are wrong and where you get paid before you click.
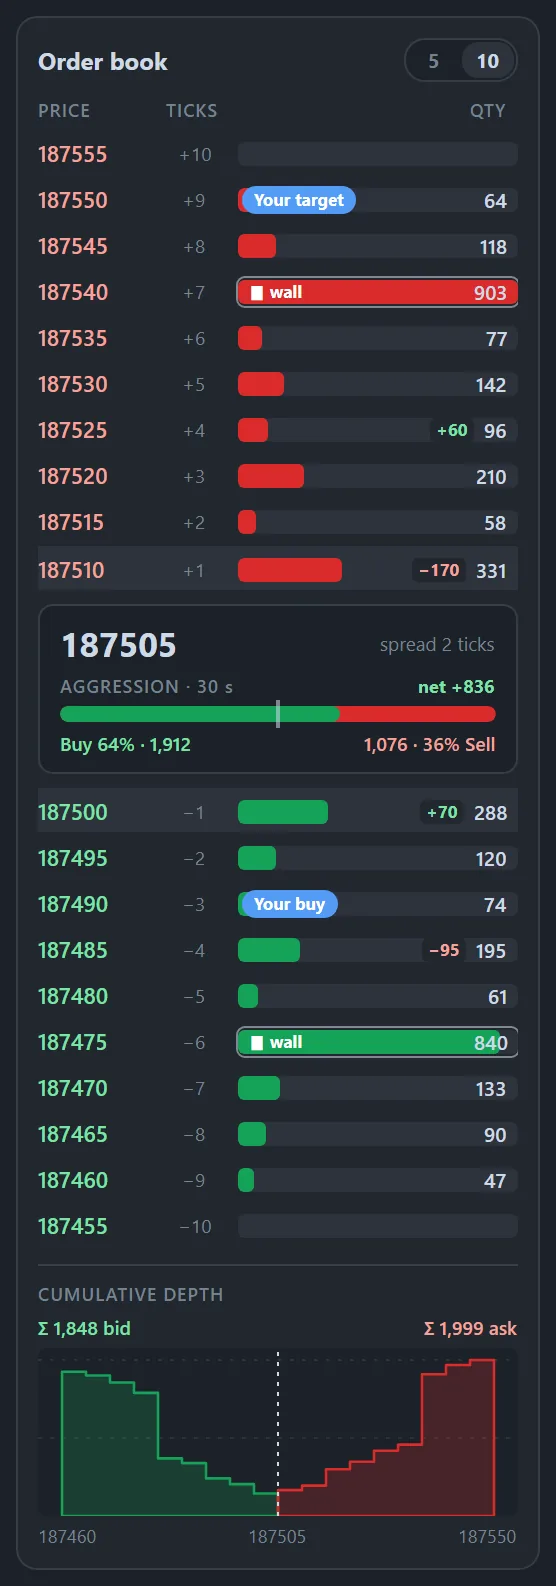
These charts come from MetaPro Trader, an AI day trading platform that runs on top of your MetaTrader 5 account. Next to the chart sits a live order book that marks your own buy and your own target among the levels, shows the last 30 seconds of aggression and the cumulative depth of each side. Click a price in the book and the order ticket switches to a limit order at that price, so the plan you see on the chart becomes an order in two clicks.
Scene 1: the first buy after a long fall
August 19, 14:20. The mini index had been falling for more than an hour, from about 171,800 to 170,800. On top, the chart with nothing on it; below, the same candles with Adaptive Math.
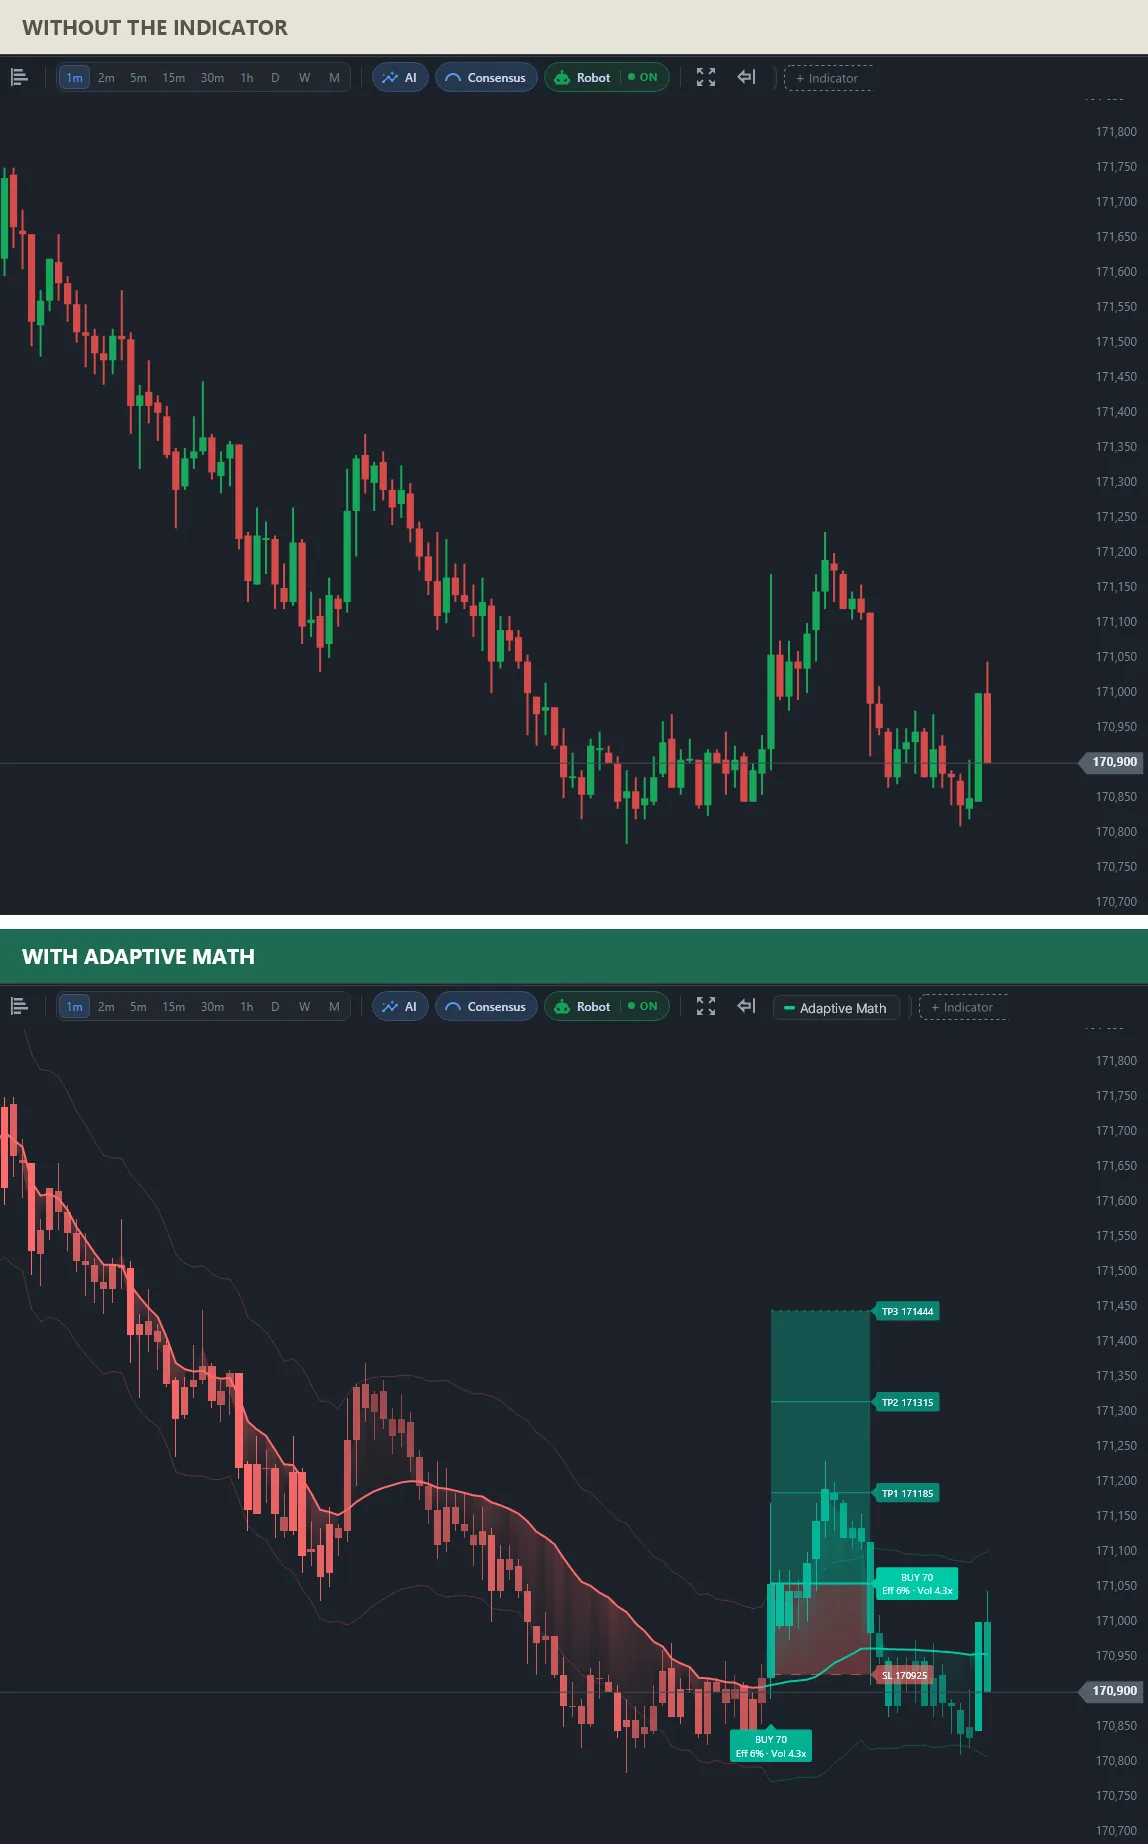
The plain chart only shows a fall that might be ending. With the indicator, the flow line turns from red to green, a BUY 70 label marks the turn and the whole plan appears at once: stop at 170,925, TP1 at 171,185, TP2 at 171,315 and TP3 at 171,444. The label also tells you why the score is what it is: efficiency 6% and volume 4.3 times the average.
On this trade price reached TP1 and then came back to the stop. That is exactly why the plan is on screen: the trader knew in advance where to secure part of the trade and how much the idea would cost if it failed.
Scene 2: a sell, a sharp drop and a buy, each with its plan
September 15, 11:00. The morning had a rally, a sudden drop of more than 1,000 points and a recovery, all inside an hour.
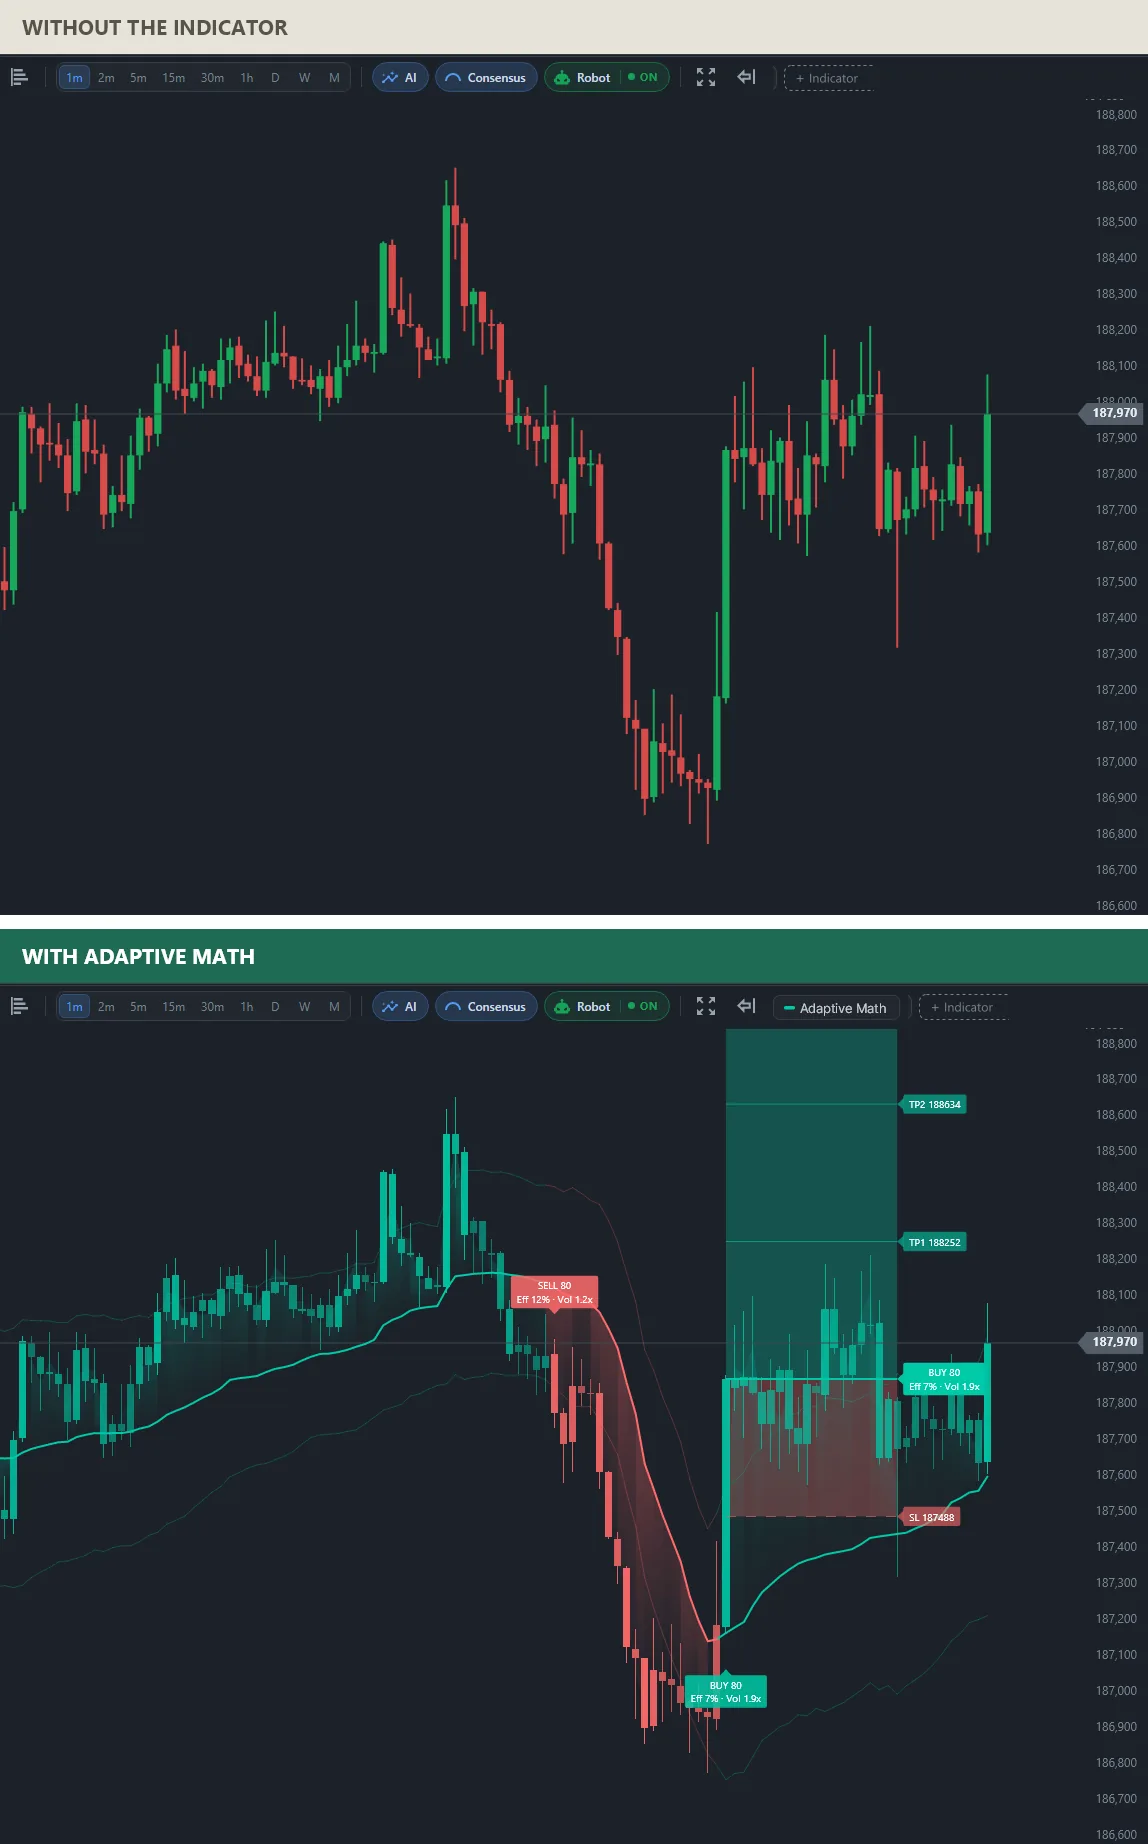
Without the indicator, the drop and the recovery look like noise. With it, the session reads as two decisions: a SELL 80 when the flow line rolled over near 188,200, and a BUY 80 after the drop, with its stop at 187,488, TP1 at 188,252 and TP2 at 188,634. The shaded areas show the risk in red and the reward in green, so the size of each bet is visible before the order goes in.
How many trade plans Adaptive Math draws in one mini index session
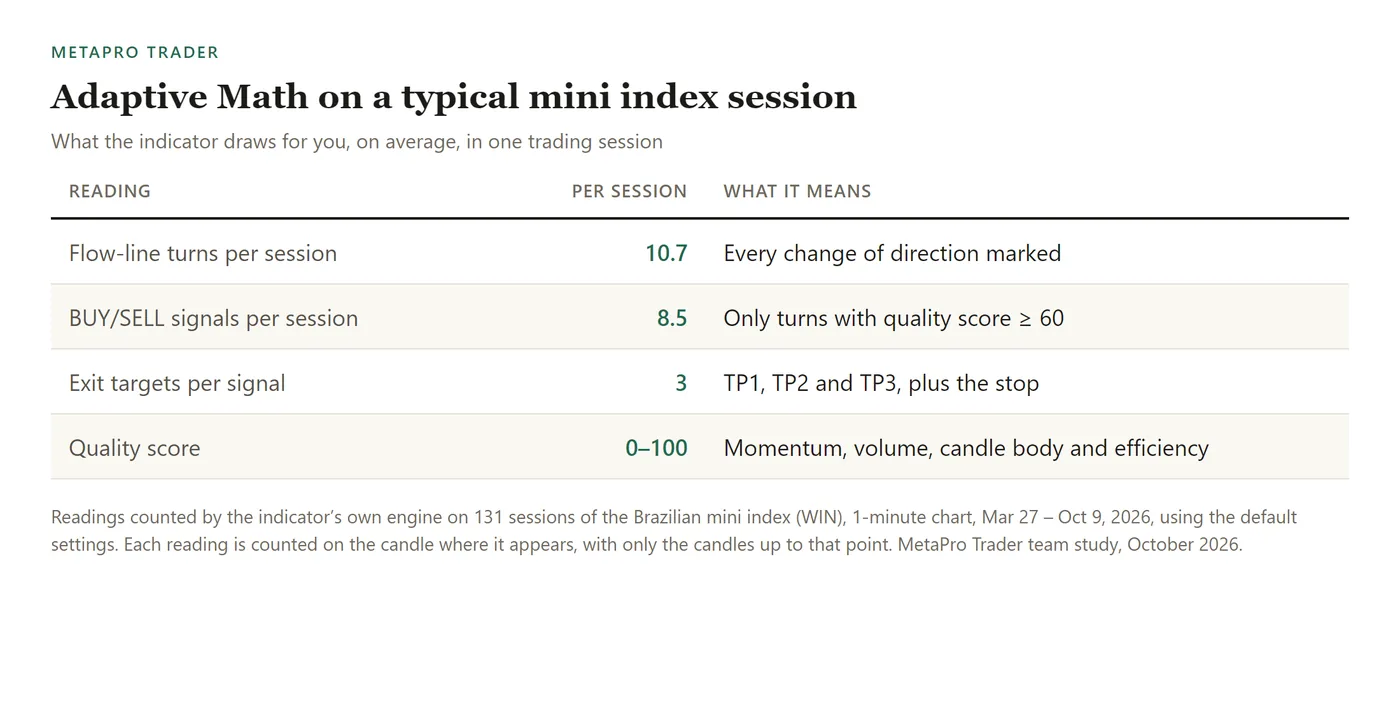
We ran Adaptive Math over 131 sessions of the Brazilian mini index (WIN), 1-minute chart, Mar 27 – Oct 9, 2026 and counted what it puts on the chart. On an average session it marks 8.5 buy and sell signals, each one with a stop and three targets, out of about 11 turns of the flow line. The quality filter is what separates the two numbers.
How to add the automatic stop loss and take profit indicator to MT5
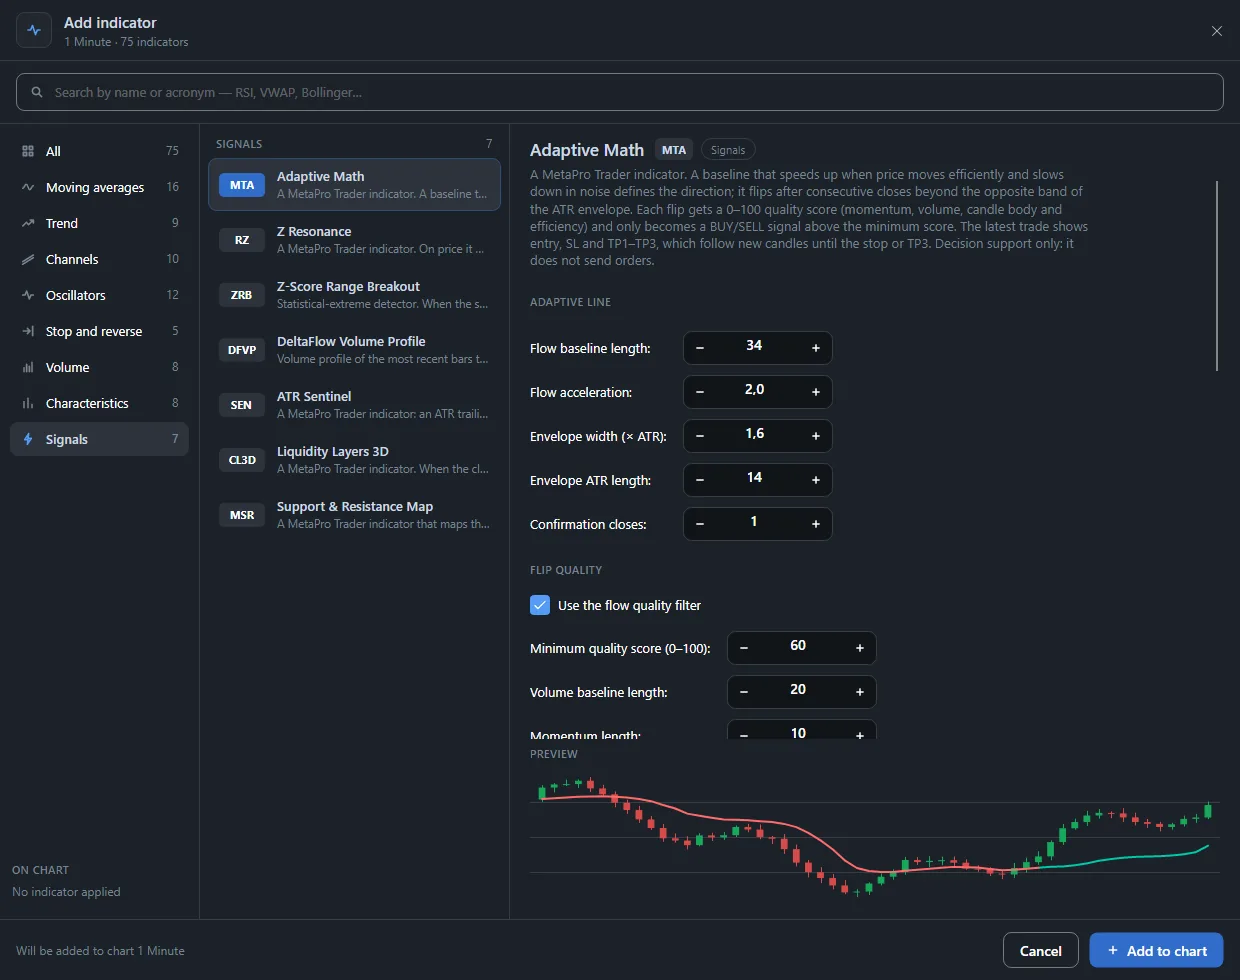
Connect your MetaTrader 5 account in MetaPro Trader, open the asset’s chart and click + Indicator. In the Signals tab, choose Adaptive Math. Raise the minimum quality score to see fewer, stronger signals; lower it to see every turn. TP1 is a natural place to secure part of the trade and let TP2 and TP3 ride the move.
This article was written by the MetaPro Trader team. The charts are real mini index sessions drawn by the indicator’s own engine. Trading in financial markets involves risk of loss; the indicator helps you read the chart and does not send orders, and nothing here is investment advice.
Learn more
- Automatic stop loss and take profit indicator for MT5
- Buy and sell signals on the exact candle
- A range breakout indicator for MT5
- All day trading indicators for MT5
- MetaPro Trader: AI day trading platform for MT5
Keep reading
- A day trading bot for the mini index: how we test MetaPro Scalp V2 before it goes live
- The Market Breadth Radar MetaTrader 5 Doesn’t Have: Stocks, Dollar and Foreign Indices From Different Brokers on One Chart
- Automatic Fibonacci Indicator for MT5: Day Trading Levels and Targets That Draw Themselves
- Machine Learning Trading Indicator for MT5: AI That Keeps Its Own Score on Screen
- Buy and Sell Signal Indicator for MT5: See the Turn on the Exact Candle
- Divergence Indicator for MT5: See When a Move Is Running Out of Strength
- Range Breakout Indicator for MT5: Catch the Breakout the Moment It Happens
- Volume Profile Indicator for MT5 Day Trading: Follow the Money, Not Just the Price
- Order Block Indicator With Volume for MT5: Find Where the Big Moves Came From
- Intraday Support and Resistance Indicator for MT5: Start the Session With the Levels Drawn
- Smart Money Concepts Indicator for MT5: Market Structure the Way Professionals Read It
- Automatic Chart Pattern Indicator for MT5: Head and Shoulders, Triangles and Flags Found for You
- Automatic Support and Resistance Indicator for MT5, Scored From 0 to 100
- Buying and Selling Pressure Indicator for MT5: Who Is Running the Market Right Now
- Volume-Based Support and Resistance Indicator for MT5: Levels Confirmed by Real Trading
- Multi-Timeframe Candle Indicator for MT5: The Daily Candle on Your 1-Minute Chart