Indicators
Volume-Based Support and Resistance Indicator for MT5: Levels Confirmed by Real Trading
Flow Profile marks support and resistance only where volume backs them, with a buying and selling volume profile and a score per level.
A level without volume is just a line
Most support and resistance tools draw a line at every swing high and low. Many of those levels never had real trading behind them: price touched them for a second and left. A level without volume is just a line.
Flow Profile + Confirmed S/R keeps only the levels the volume confirms. It builds a volume profile beside the chart, with estimated buying and selling in each row and the point of control, and promotes a high or low to support or resistance only when there was enough volume around it. Each level gets a score, and a broken level leaves the chart by itself.
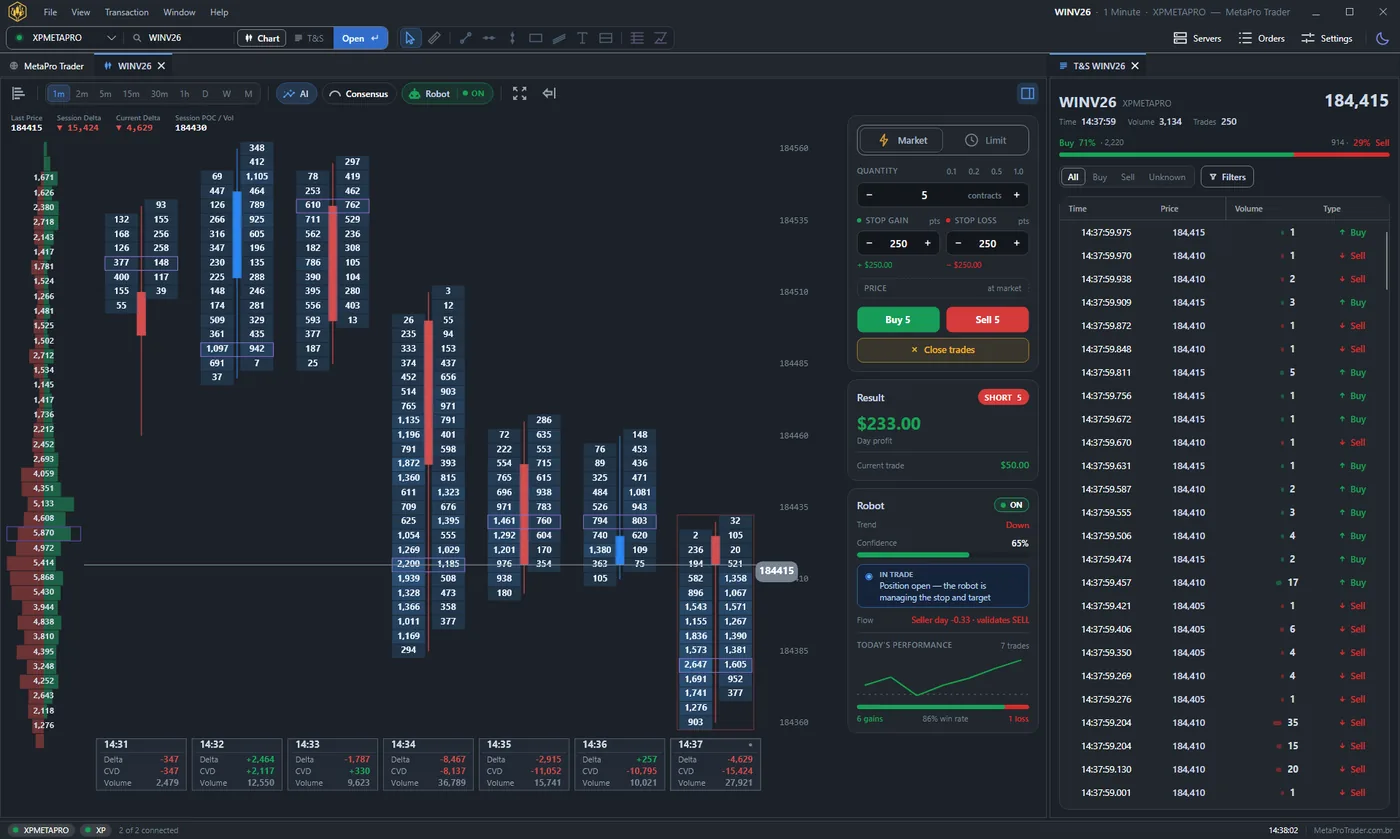
These profiles were drawn in MetaPro Trader, a day trading platform for MT5 whose order flow chart goes one level deeper: the volume at every price inside every candle, with the delta, the CVD and the volume of each candle below the chart. The profile in this article summarizes a window of candles; the order flow chart shows the same information one candle at a time.
Scene 1: two supports confirmed under a rising market
August 31, 13:30. The mini index had climbed from about 179,400 to 180,170.
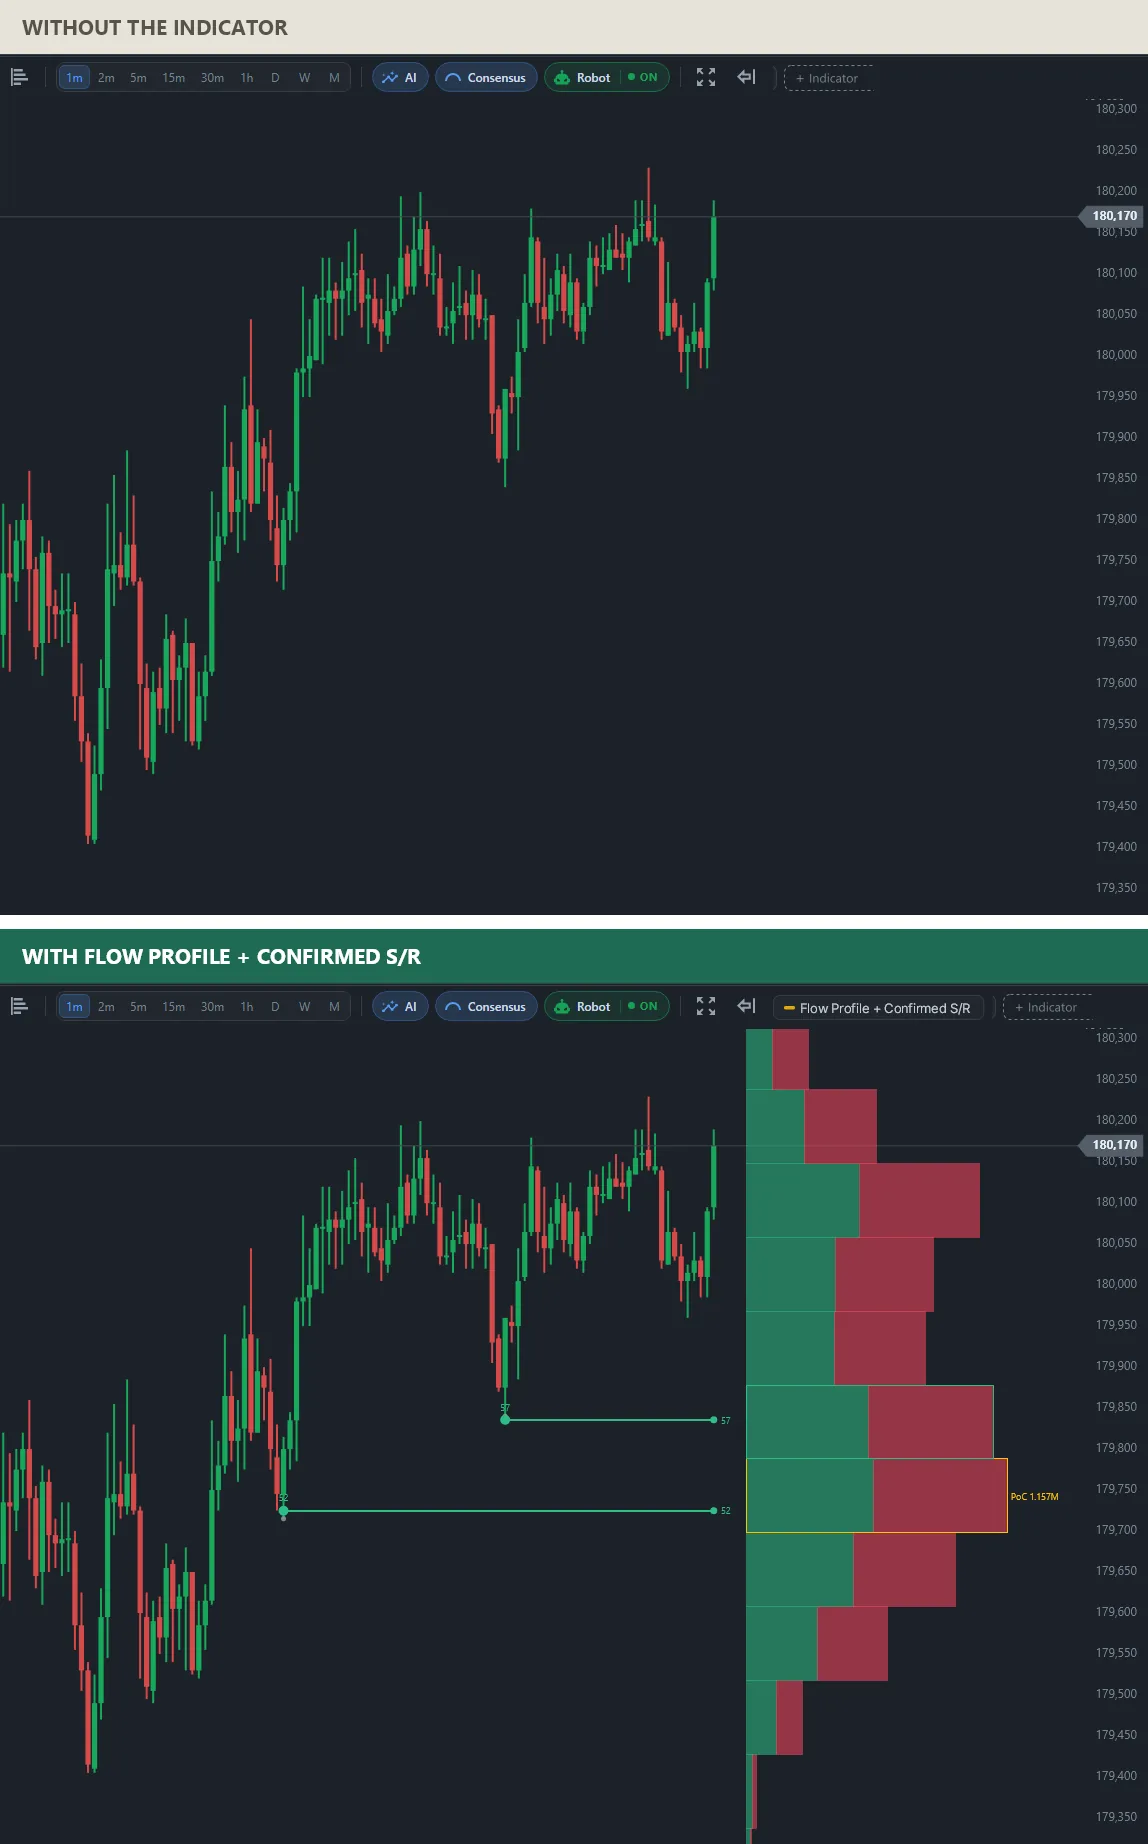
Of all the dips in this climb, only two became supports, because only two had volume behind them: one near 179,836 with a score of 57 and one near 179,725 with a score of 52. The second sits right on the point of control of the window, the row with 1.157M traded. A support on the busiest price of the profile is the kind of level this indicator was made to find.
Scene 2: one resistance and a market sitting on its PoC
August 14, 12:30. After a fall from 169,700, the mini index spent hours going sideways around 168,745.
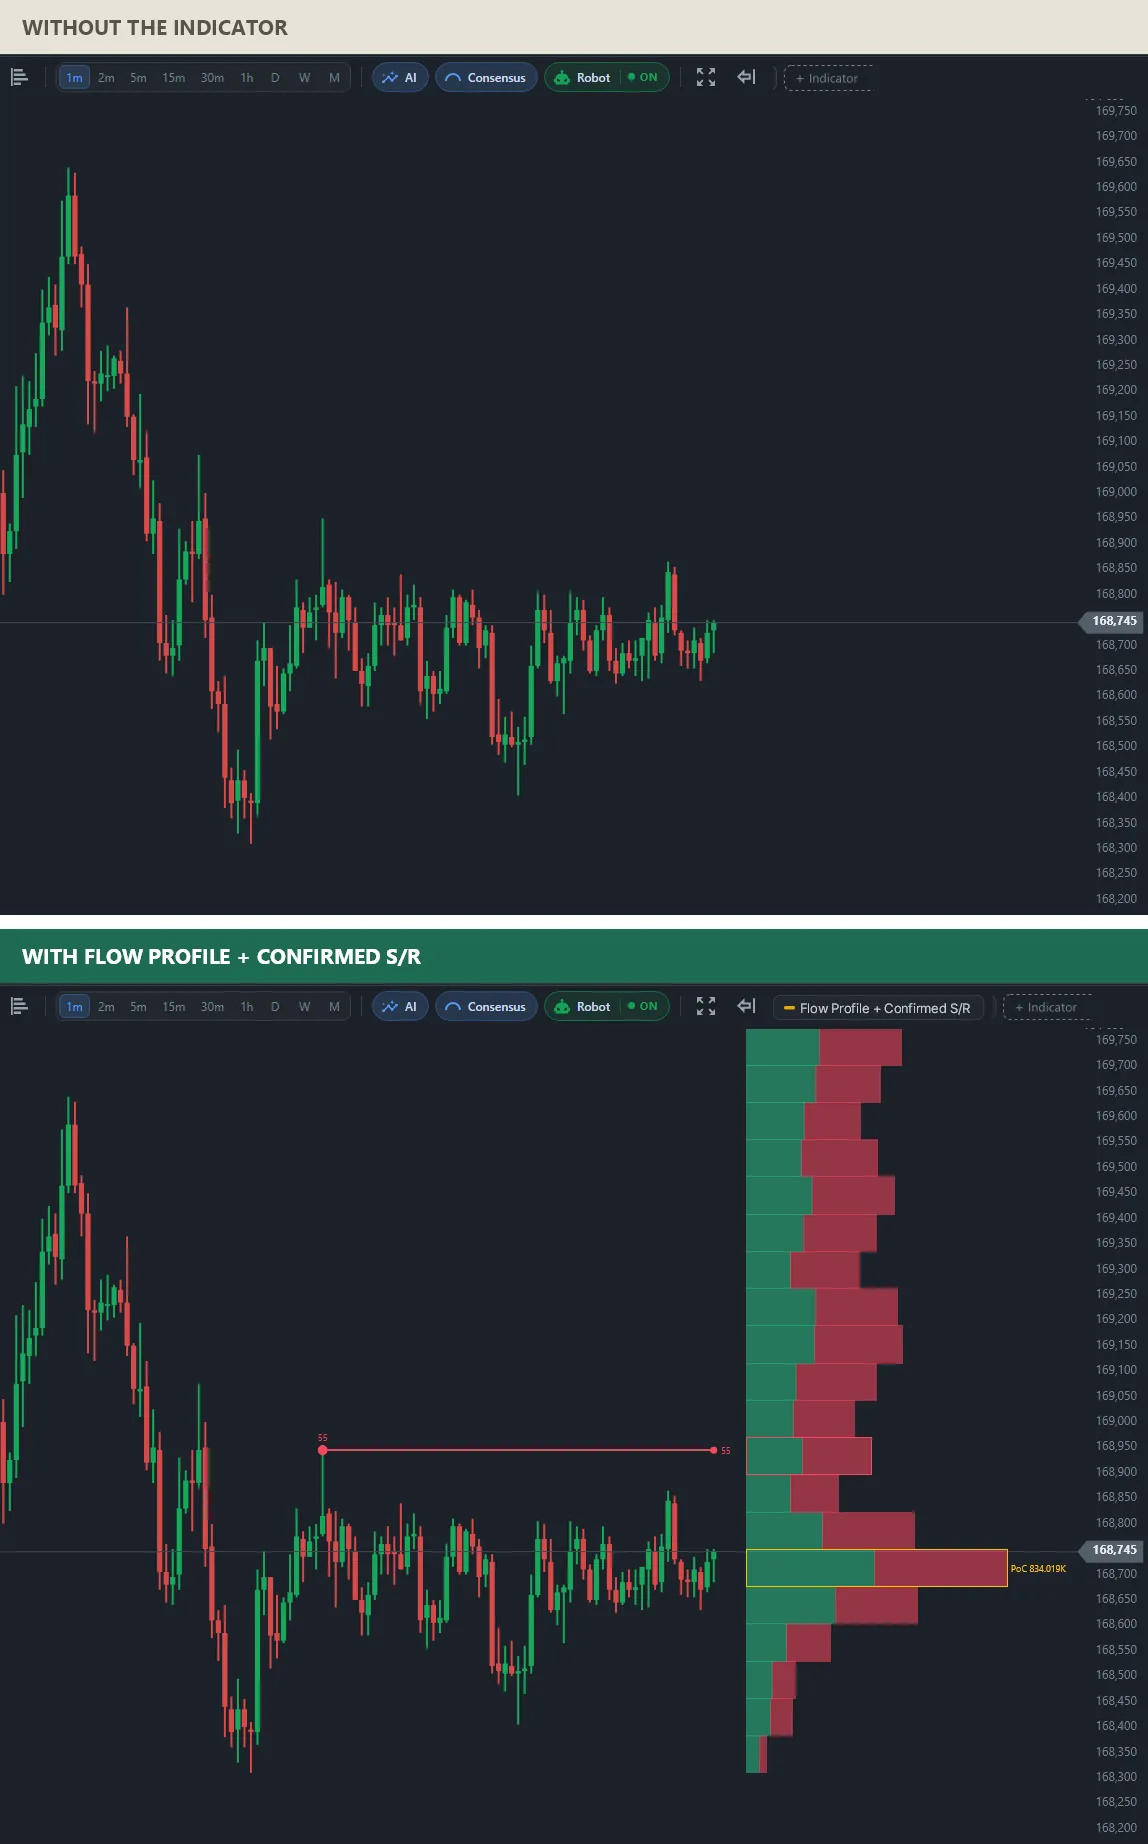
The sideways hours produced a single confirmed level: a resistance near 168,925 with a score of 55, built from the bounce high. Price itself sits on the point of control, near 168,725 with 834K traded. The profile explains the quiet afternoon: the market is at the price where it did most of its business.
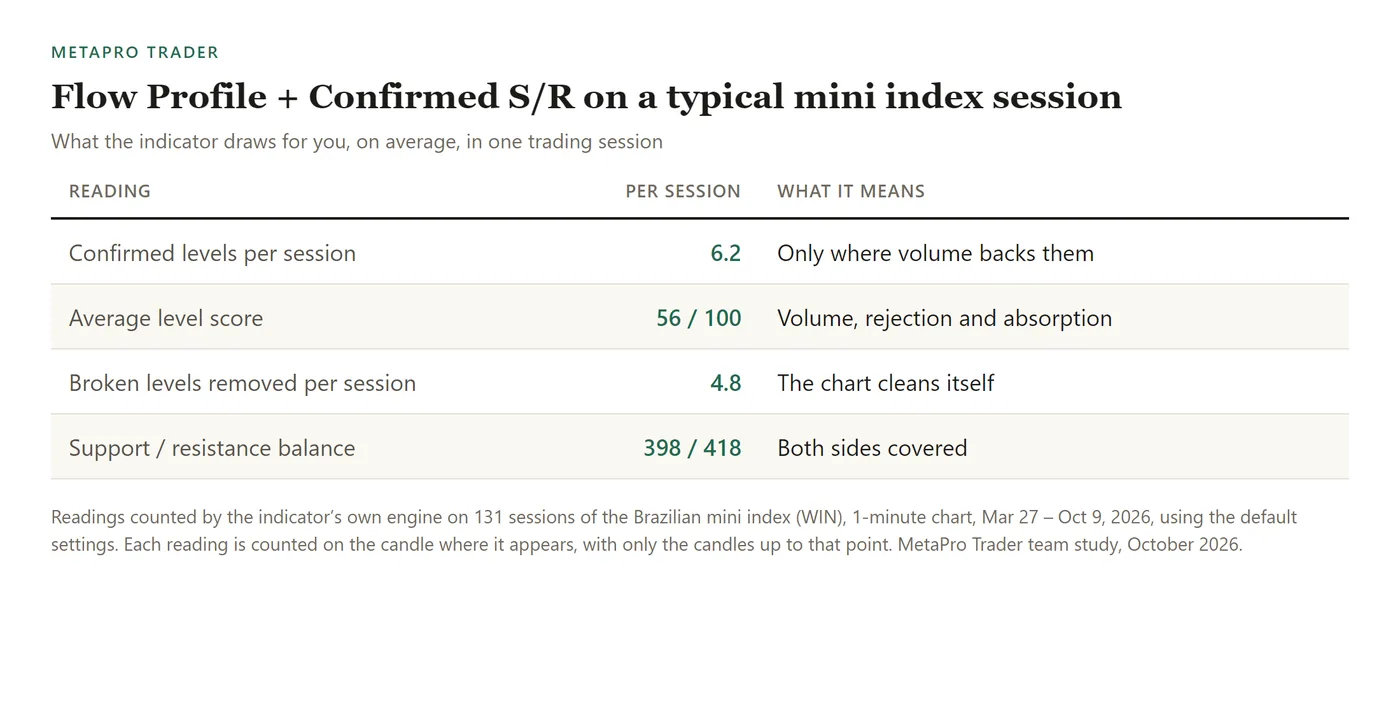
Volume-confirmed levels per mini index session
On 131 sessions of the Brazilian mini index (WIN), 1-minute chart, Mar 27 – Oct 9, 2026, the indicator confirmed 6.2 levels per session on average, with an average score of 56 out of 100, and removed 4.8 broken levels per session. Supports and resistances came out almost even: 398 and 418.
How to add the volume-based support and resistance indicator to MT5
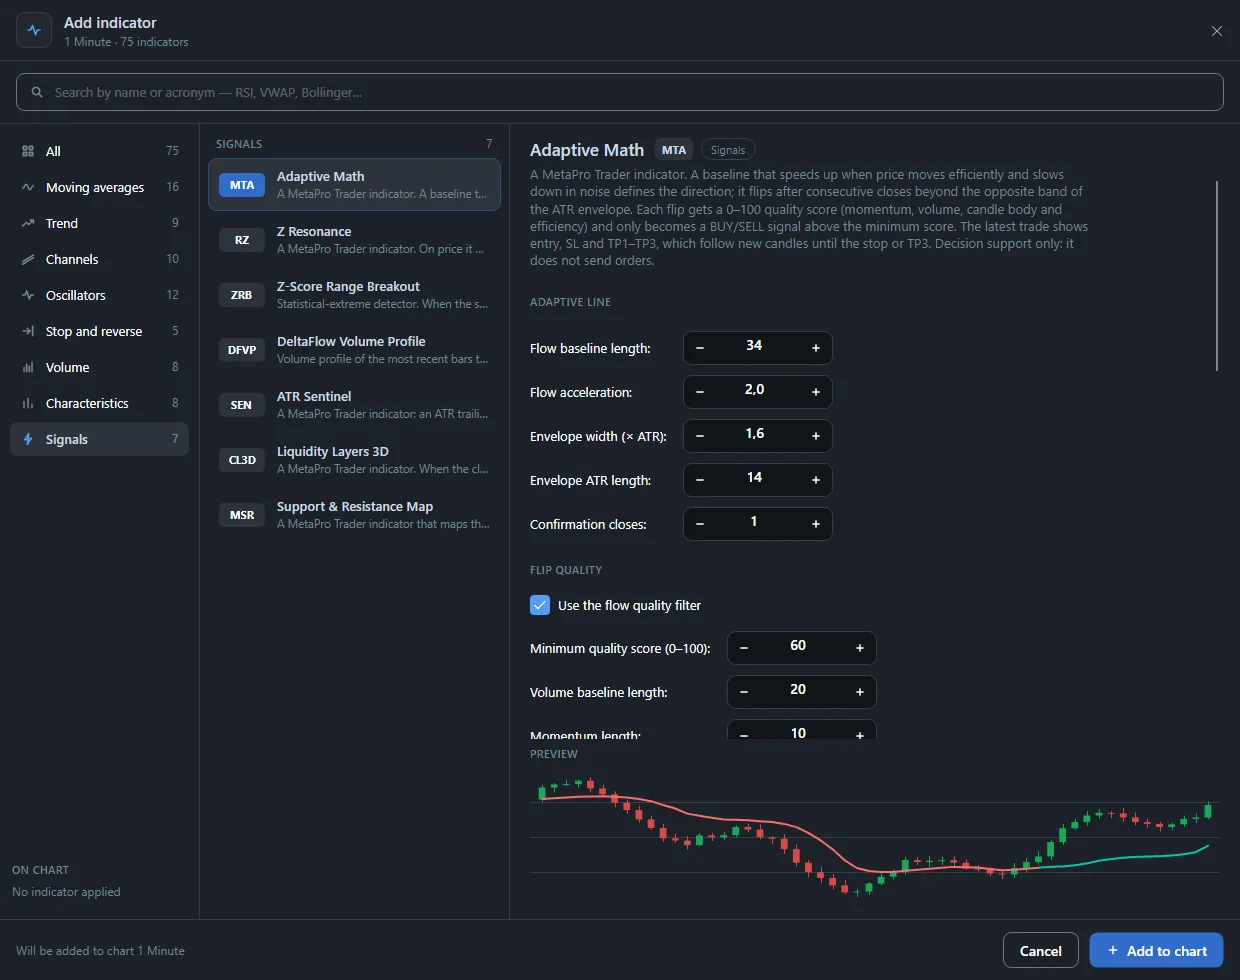
Connect MetaTrader 5 in MetaPro Trader, open the chart, click + Indicator and select Flow Profile + Confirmed S/R in the Signals tab. A higher minimum score keeps only the best-backed levels; the PoC row is the most traded price of the window.
The MetaPro Trader team wrote this article using real mini index data. The indicator is a reading tool: it does not trade for you, past charts do not predict future ones, and trading carries risk of loss.
Learn more
- Support and resistance by volume indicator for MT5
- A volume profile with buying and selling per price
- Support and resistance zones scored 0 to 100
- Every indicator in the Signals tab
- Day trading with AI on MT5: MetaPro Trader
Keep reading
- A day trading bot for the mini index: how we test MetaPro Scalp V2 before it goes live
- The Market Breadth Radar MetaTrader 5 Doesn’t Have: Stocks, Dollar and Foreign Indices From Different Brokers on One Chart
- Automatic Fibonacci Indicator for MT5: Day Trading Levels and Targets That Draw Themselves
- Machine Learning Trading Indicator for MT5: AI That Keeps Its Own Score on Screen
- Automatic Stop Loss and Take Profit Indicator for MT5: Trade With the Plan on the Chart
- Buy and Sell Signal Indicator for MT5: See the Turn on the Exact Candle
- Divergence Indicator for MT5: See When a Move Is Running Out of Strength
- Range Breakout Indicator for MT5: Catch the Breakout the Moment It Happens
- Volume Profile Indicator for MT5 Day Trading: Follow the Money, Not Just the Price
- Order Block Indicator With Volume for MT5: Find Where the Big Moves Came From
- Intraday Support and Resistance Indicator for MT5: Start the Session With the Levels Drawn
- Smart Money Concepts Indicator for MT5: Market Structure the Way Professionals Read It
- Automatic Chart Pattern Indicator for MT5: Head and Shoulders, Triangles and Flags Found for You
- Automatic Support and Resistance Indicator for MT5, Scored From 0 to 100
- Buying and Selling Pressure Indicator for MT5: Who Is Running the Market Right Now
- Multi-Timeframe Candle Indicator for MT5: The Daily Candle on Your 1-Minute Chart