Indicators
Divergence Indicator for MT5: See When a Move Is Running Out of Strength
Z Resonance marks divergences between price and strength and colors the trend band, so you avoid buying the top of a move.
The most expensive candle of the day
The most expensive candle of the day is often the one that looks the strongest. It closes at the high, the breakout feels confirmed, and that is precisely when the buyers behind the move are running out.
Z Resonance is built to see that fatigue. It compares the new highs and lows of price with the strength behind them and puts an Up or Down mark on the chart when the two stop agreeing. Around price, a band changes color with the direction, so trend and fatigue live on the same chart.
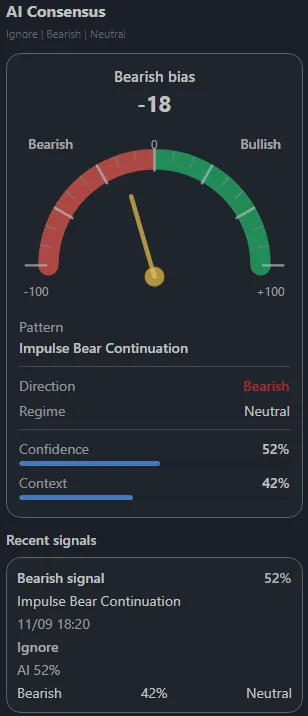
MetaPro Trader, where these charts were drawn, adds a second opinion to every indicator: the Consensus AI panel. It condenses the AI’s reading of the asset into one gauge from −100 to +100, with the pattern behind it, the direction, the market regime, a confidence bar and the list of recent signals. The AI behind the gauge is set up for each asset and timeframe from that asset’s own history, so the mini index is read as the mini index.
Scene 1: a falling market whose selling pressure is fading
August 7, 13:00. The mini index had dropped from about 177,700 to 176,250.
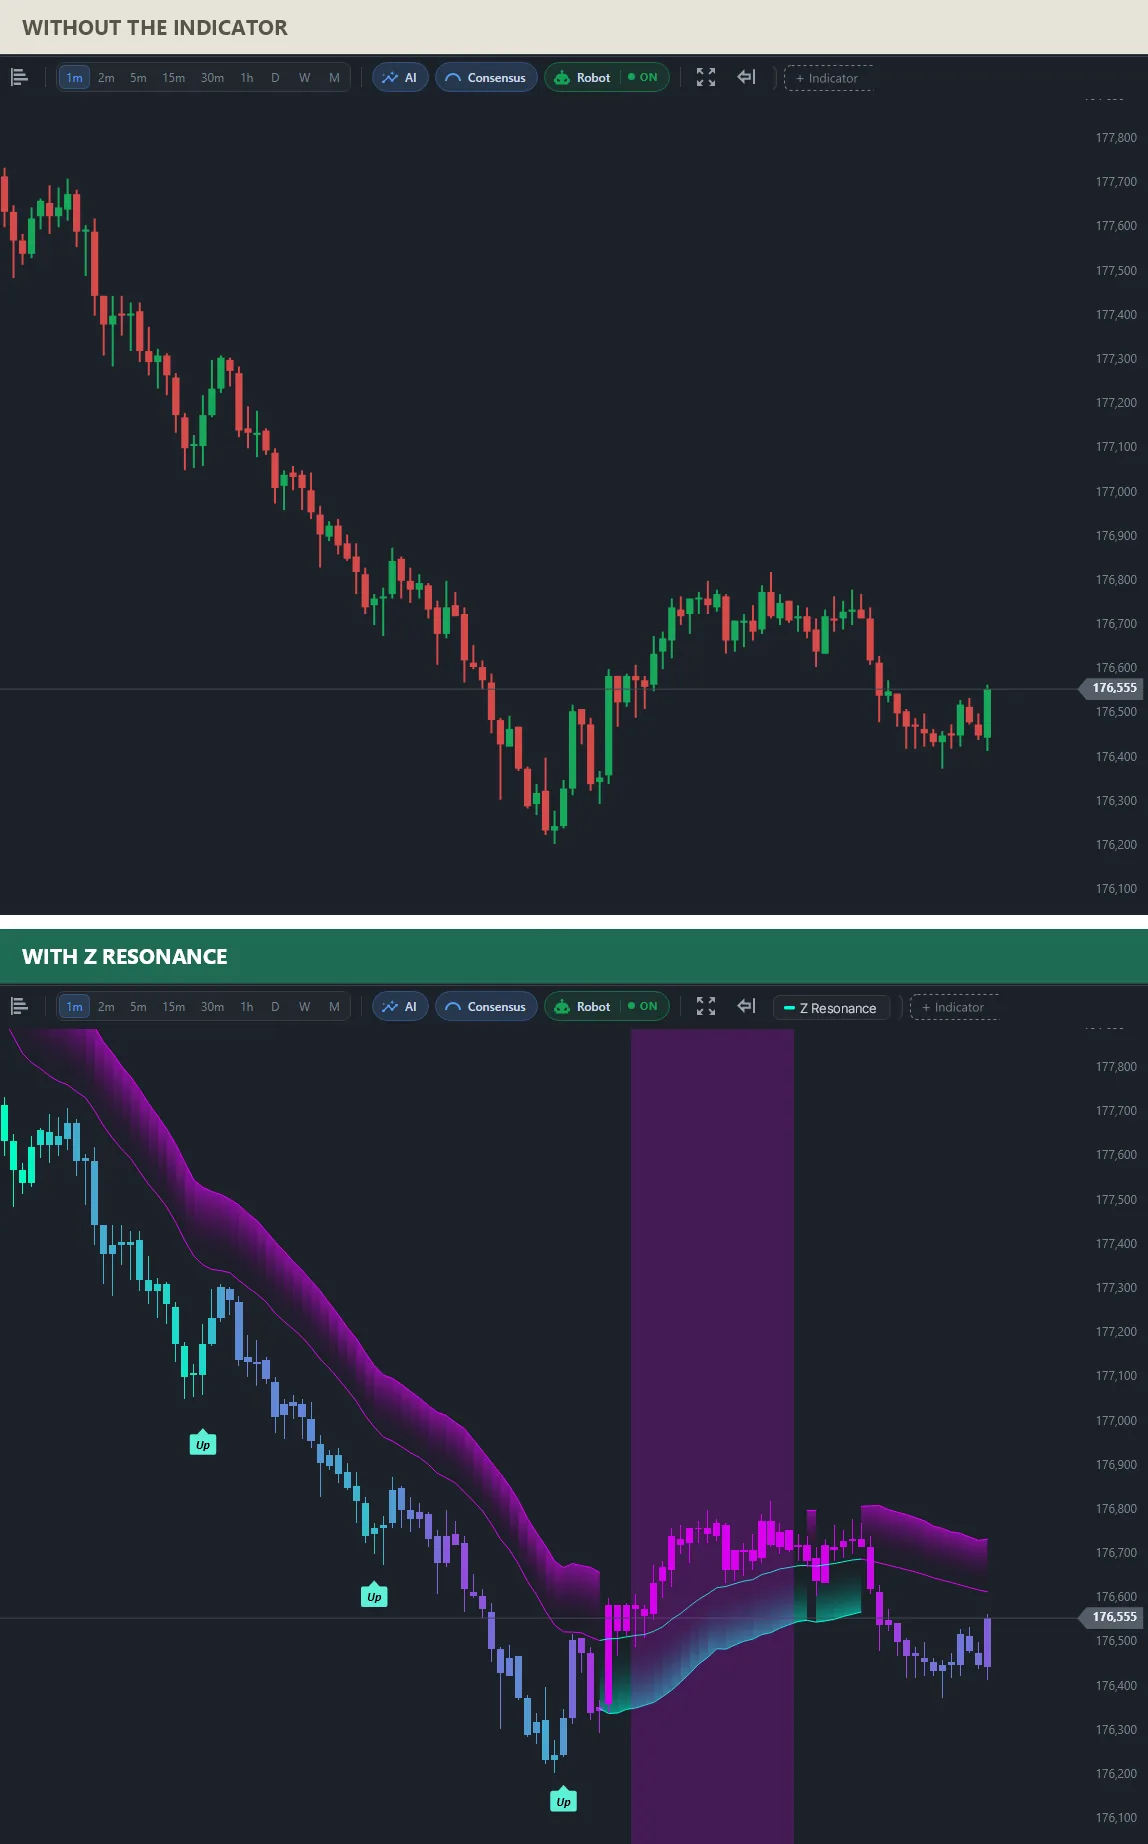
On the plain chart the fall looks steady. Z Resonance marks three Up divergences along the way: price kept printing lower lows, but the strength behind each new low was weaker than the one before. The last mark sits at the bottom of the move. After it, price climbed back towards 176,800 and, during that climb, the band turned from magenta above price to teal below it.
Scene 2: a new high that strength does not confirm
September 2, 16:20, near the end of one of the strongest rallies of the period, the mini index was trading close to 187,950.
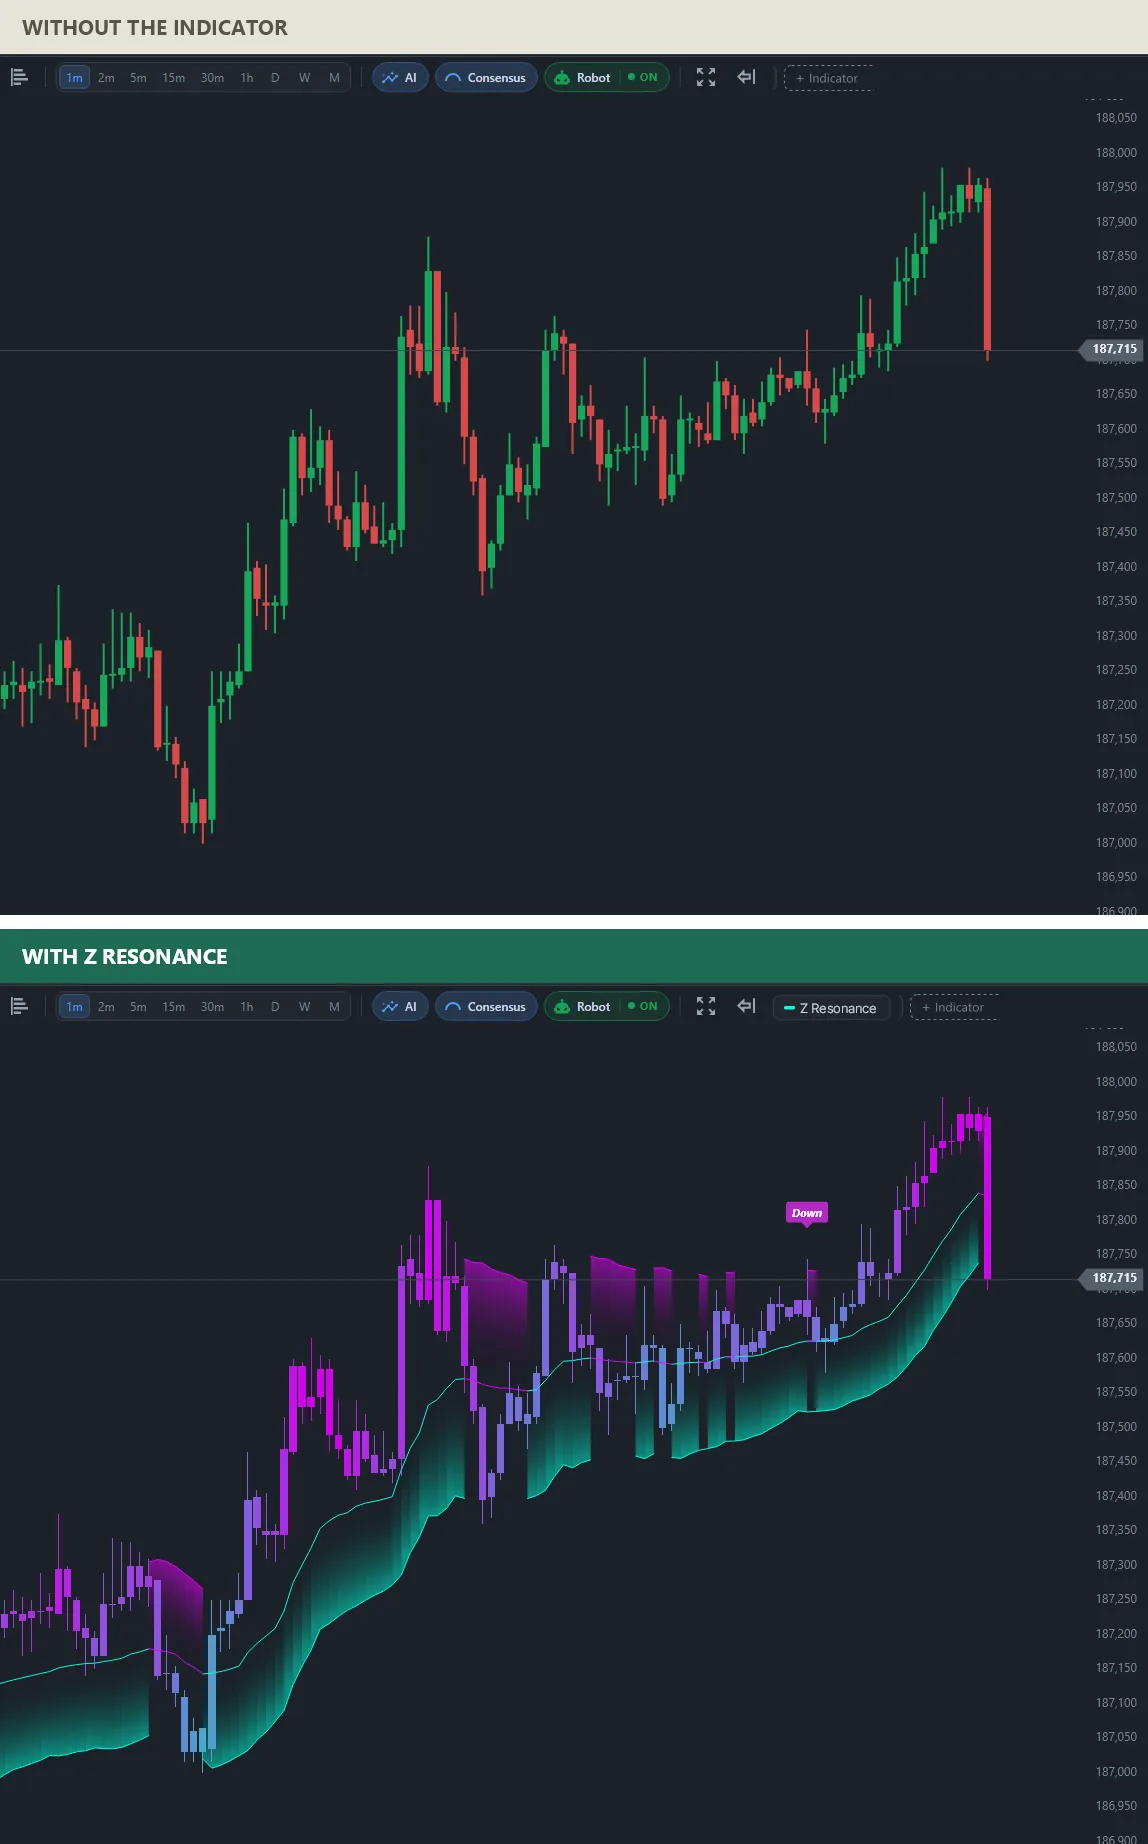
Without the indicator, the last push higher looks like more of the same. With it, a Down mark appears near 187,800: price went higher, the strength did not. That is not an order to sell; it is a reason not to chase. A few candles later the session’s last candle dropped back to 187,715.
Divergences and trend color turns on a typical mini index session
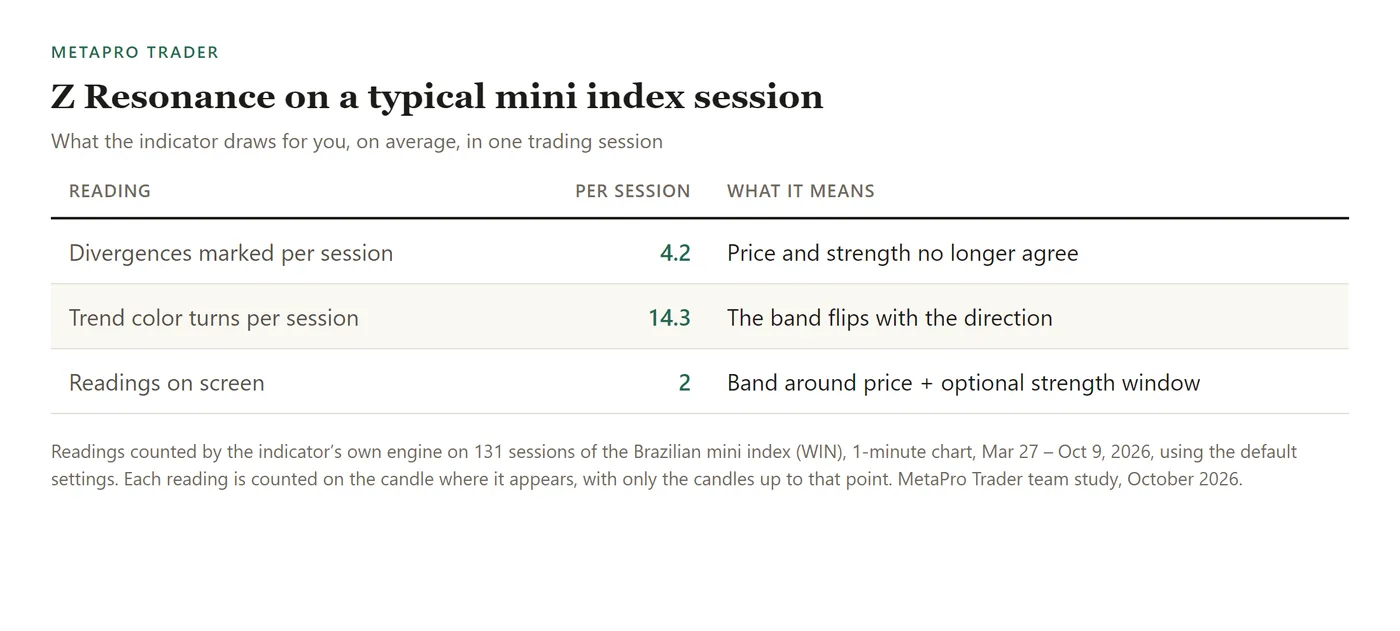
Over 131 sessions of the Brazilian mini index (WIN), 1-minute chart, Mar 27 – Oct 9, 2026, Z Resonance marked 4.2 divergences per session on average, while the band changed color 14.3 times. Divergences are rare on purpose: they flag the moments worth a second look.
How to add the divergence indicator to MT5
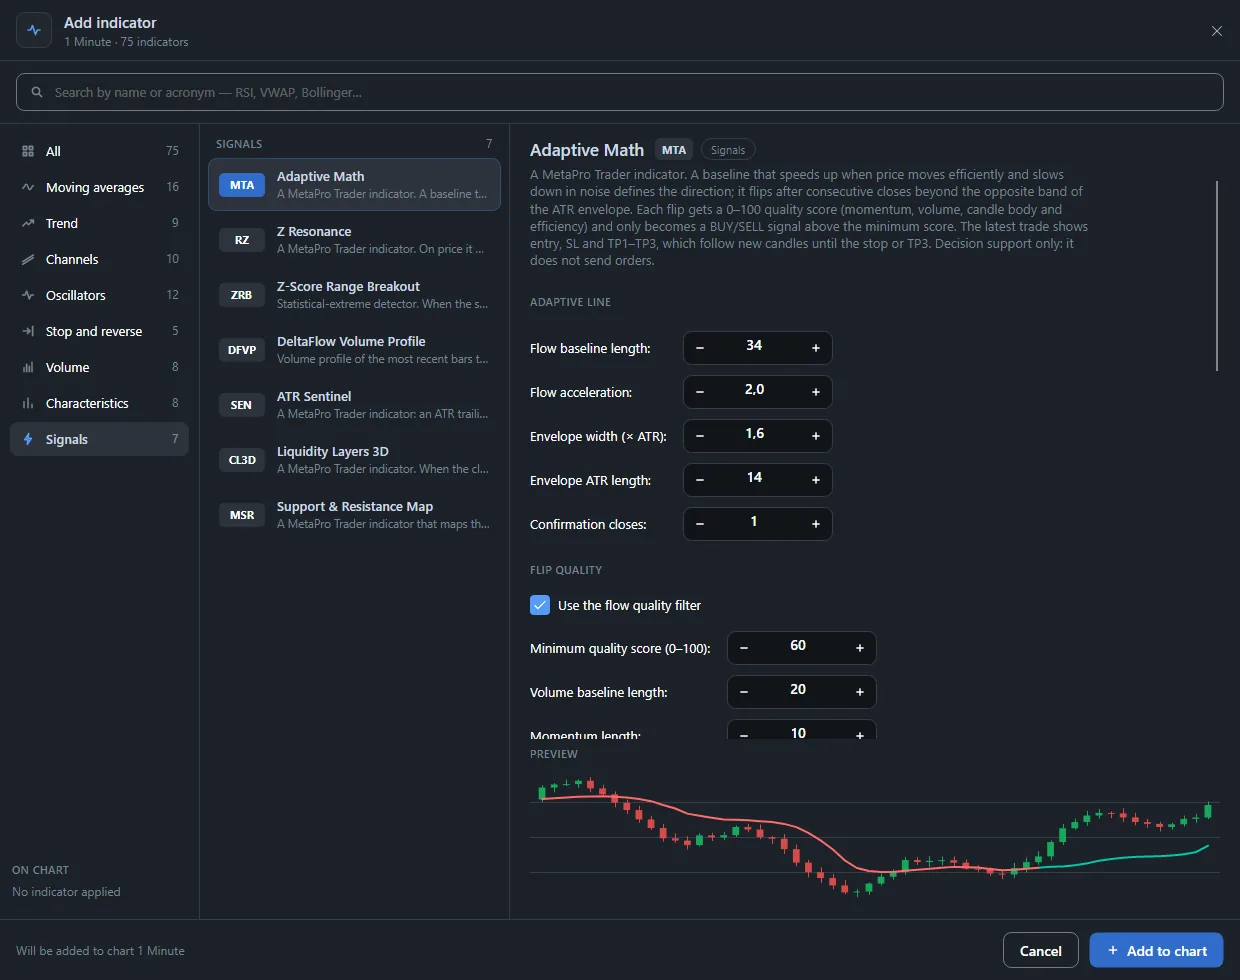
Connect MetaTrader 5 in MetaPro Trader, open the chart and click + Indicator. The divergence indicator is Z Resonance, in the Signals tab. Treat each mark as a cue to wait for the next candles, not as an entry, and open the strength sub-window whenever you want to watch the divergence building.
The MetaPro Trader team wrote this article using real mini index data. The indicator is a reading tool: it does not trade for you, past charts do not predict future ones, and trading carries risk of loss.
Learn more
- Divergence indicator for MT5 day trading
- A buy and sell indicator that marks the turn
- A machine learning indicator for MT5
- More indicators for MT5 day trading
- The MetaPro Trader platform
Keep reading
- A day trading bot for the mini index: how we test MetaPro Scalp V2 before it goes live
- The Market Breadth Radar MetaTrader 5 Doesn’t Have: Stocks, Dollar and Foreign Indices From Different Brokers on One Chart
- Automatic Fibonacci Indicator for MT5: Day Trading Levels and Targets That Draw Themselves
- Machine Learning Trading Indicator for MT5: AI That Keeps Its Own Score on Screen
- Automatic Stop Loss and Take Profit Indicator for MT5: Trade With the Plan on the Chart
- Buy and Sell Signal Indicator for MT5: See the Turn on the Exact Candle
- Range Breakout Indicator for MT5: Catch the Breakout the Moment It Happens
- Volume Profile Indicator for MT5 Day Trading: Follow the Money, Not Just the Price
- Order Block Indicator With Volume for MT5: Find Where the Big Moves Came From
- Intraday Support and Resistance Indicator for MT5: Start the Session With the Levels Drawn
- Smart Money Concepts Indicator for MT5: Market Structure the Way Professionals Read It
- Automatic Chart Pattern Indicator for MT5: Head and Shoulders, Triangles and Flags Found for You
- Automatic Support and Resistance Indicator for MT5, Scored From 0 to 100
- Buying and Selling Pressure Indicator for MT5: Who Is Running the Market Right Now
- Volume-Based Support and Resistance Indicator for MT5: Levels Confirmed by Real Trading
- Multi-Timeframe Candle Indicator for MT5: The Daily Candle on Your 1-Minute Chart